AD Insights Console
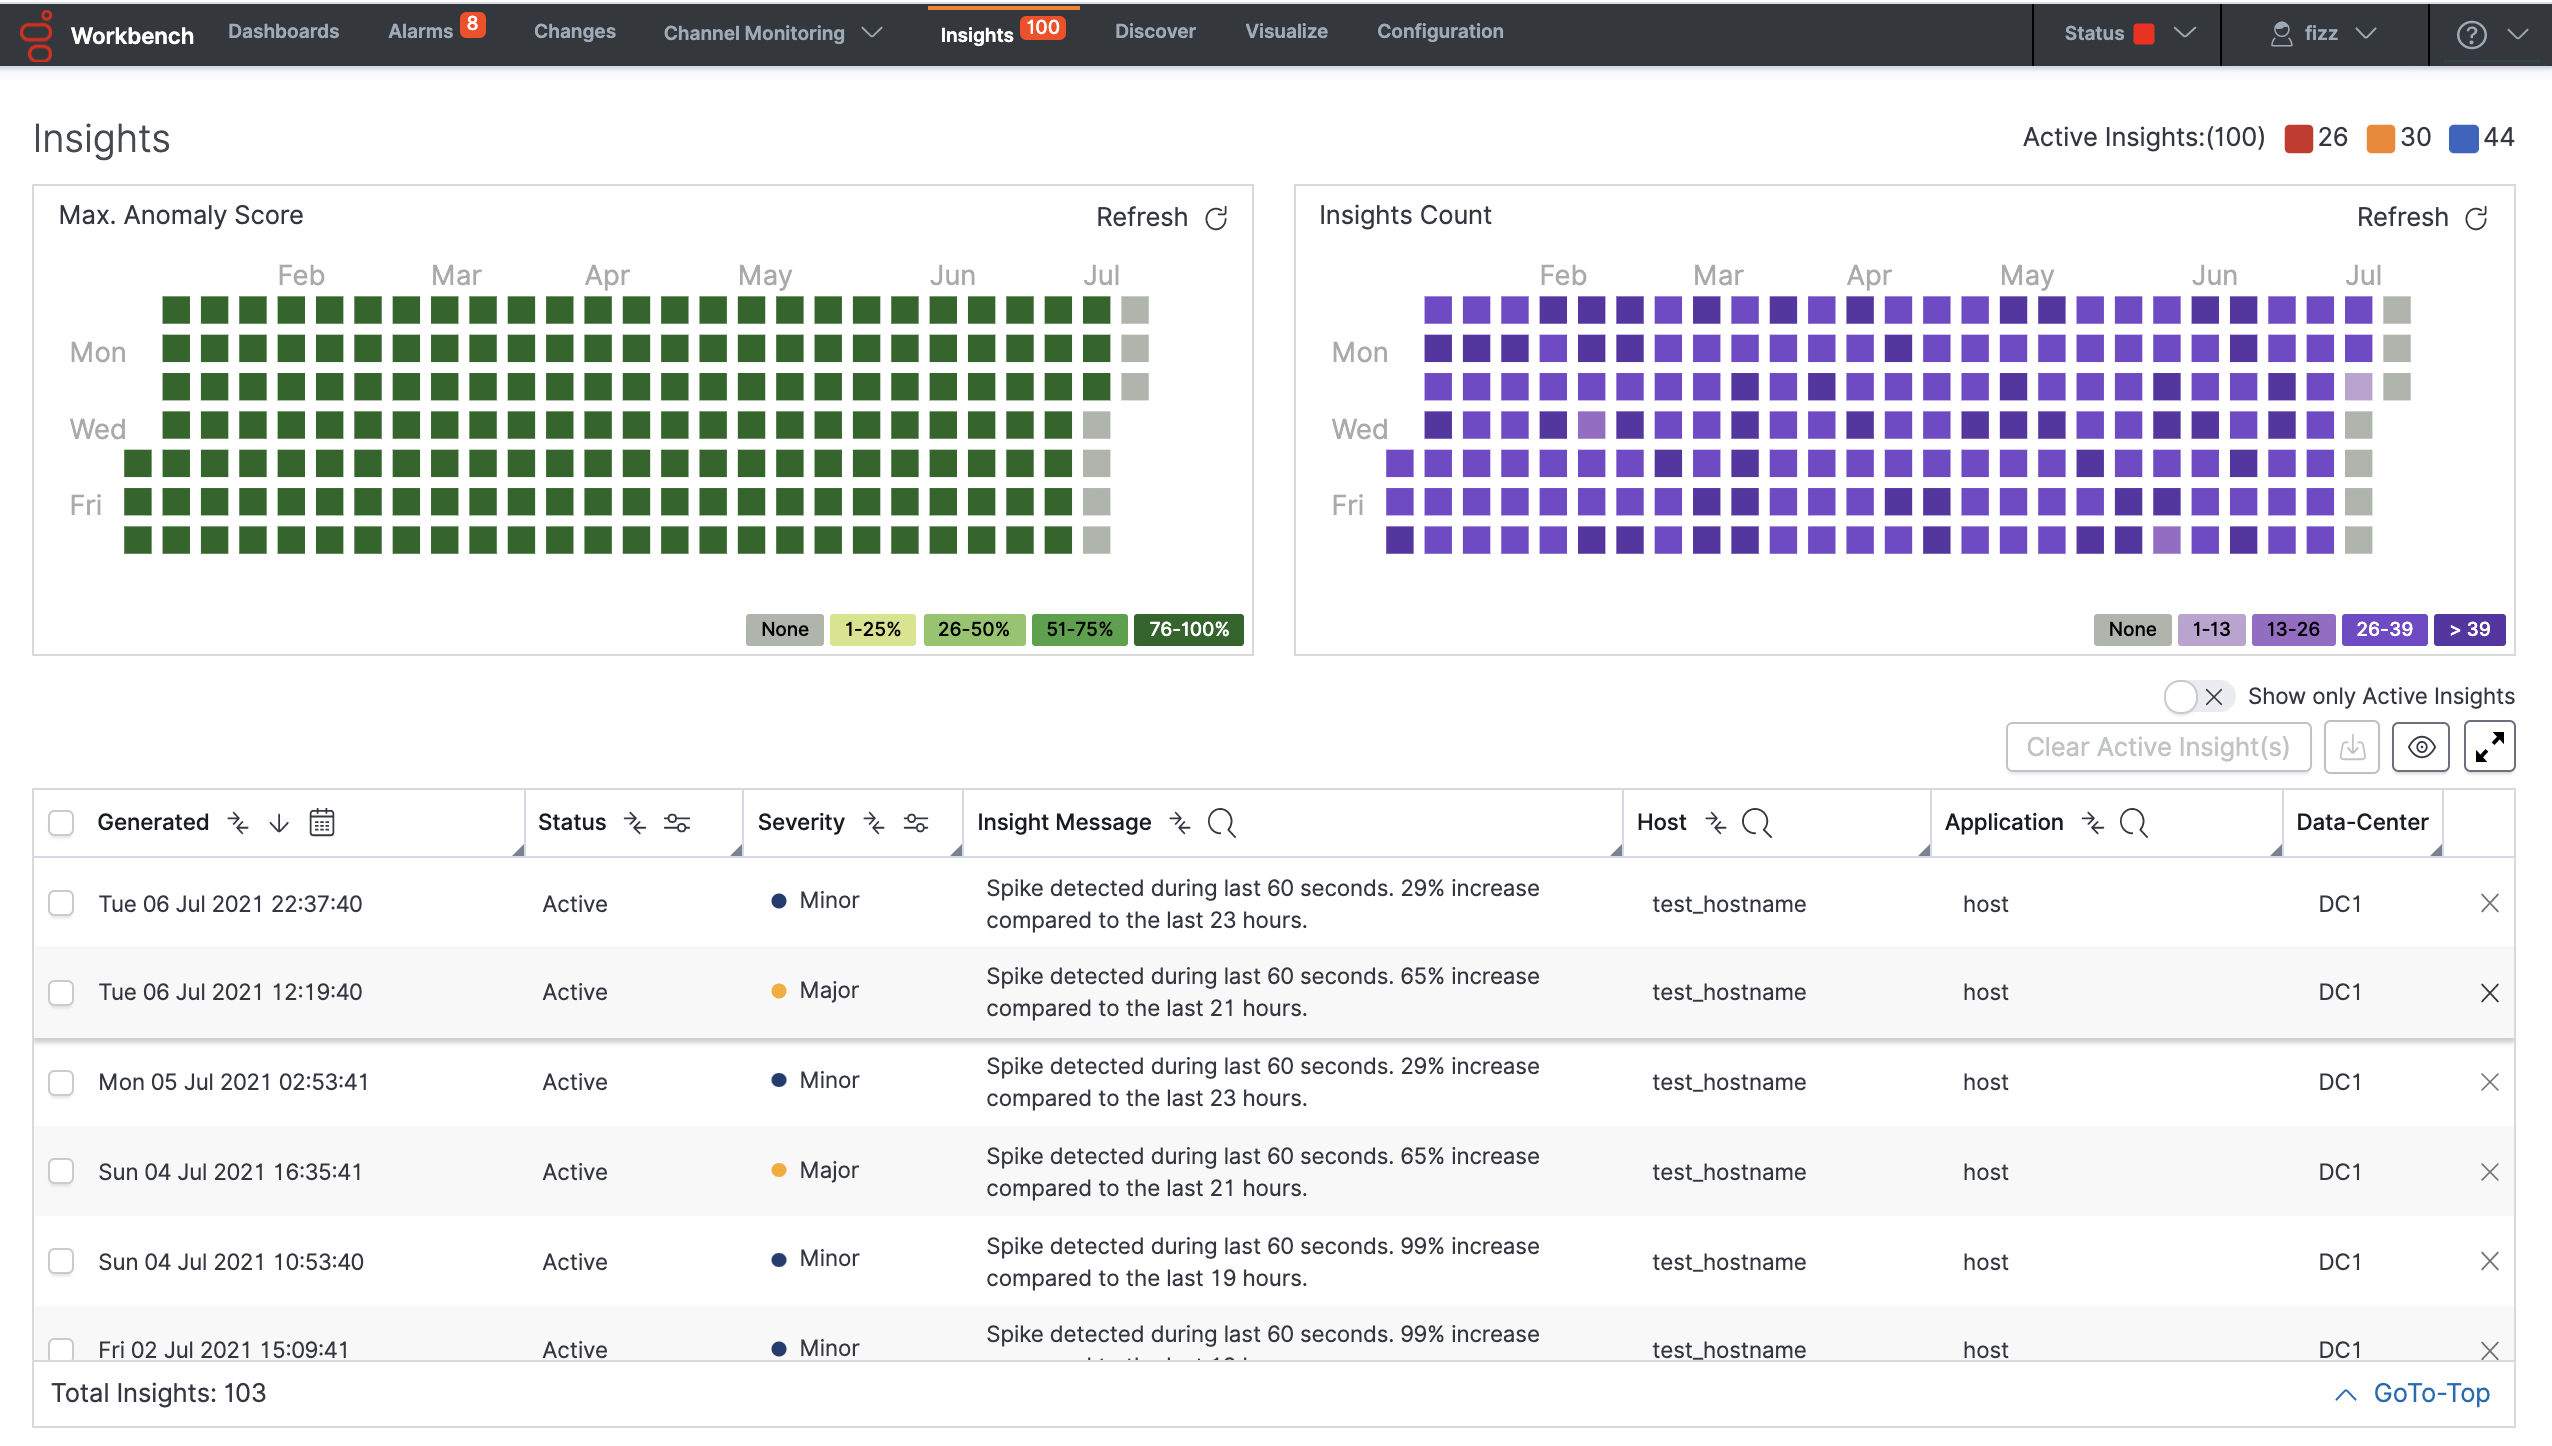
The Workbench Insights Console is a dedicated console page that displays:
- a real-time statistics summary of Active Insights/anomalies - Critical, Major, Minor
- a statistics summary Heat-map of historic Insights/anomalies - Score and Count - not real-time; click Refresh to update
- a real-time Data-table of Active and Closed Insights/Anomalies
- Workbench Insights are not necessarily always actionable, they may be merely informational events that the user can review to determine if further investigation/analysis is required
- i.e. utilize the Workbench Dashboards and Visualizations to dig deeper and determine if the Workbench Insights are truly business impacting issues
- Insights are not automatically closed and are required to be manually closed. Only closed insights are purged from the system after exceeding the environments configured retention period.
- In case of a switchover, where an Additional Anomaly Detection node is elevated to Primary, a period of 1 hour is reserved to ensure all models are accurately updated across nodes to reflect current state. During this period, new Workbench Insights will not be available.
Statistics Summary
The statistics summary of Active Insights, displays Active total Critical (![]() ), Major(
), Major(![]() ), and Minor(
), and Minor(![]() )
)
Historic Heat-maps Summary
The statistics summary of historic Insights displays the last 6 months of summary data in the following graphical representation:

Max. Anomaly Score
The Max. Anomaly Score heat-map panel displays the maximum anomaly score detected by AD for each day.
Each square shows the specific source with the highest anomaly score that day: date, anomaly score value, data center name, host name and metric name. In this graph, the ranges are set as follows:
- 1% - 25%: Normal Behavior
- 25% - 50%: Minor Insights
- 51% - 75%: Major Insights
- 76% - 100%: Critical Insights
Insights Count
The Insights Count heat-map panel displays the number of anomalies detected with an anomaly score greater than 25% for each day.
Each square shows the date and the number of Insights detected that day; the ranges are calculated based on the maximum value detected during the last 6 months.
- The AD Heat-maps display data based on the Workbench data Retention Period parameter
- The Workbench Retention Period is 30 days by default; therefore, by default the AD Heat-maps will show the last 30 days of AD Insights
- If/when the Workbench Retention Period is changed, the AD Heat-map display will be reflected accordingly; up to a maximum of the last 6 months of AD Insights
- Details of the Workbench Retention Period setting can be found here
Data-Table
The real-time Insights Console data-table displays Workbench Insights - Machine Learning Anomalies raised with an anomaly score greater than 25%.
Data-Table Default Columns
- Generated - The date and time of an insight anomaly generation. ( Note: Timestamps are stored in UTC and translated to local time based on the Users Browser Time-Zone)
- Status - Indicates insight status is Active or Closed.
- Severity - Denotes the severity of the anomaly . It can be Critical , Major, and Minor.
- Insight Message - The message about the anomaly event in text format.
- Host - The name of the Host/Server associated to the anomaly event.
- Application - The name of the application associated to the anomaly event.
- Data-Center - The name of the Data-Center associated to the anomaly event.
Data-Table Additional Columns
Note: Additional column able to select using show/hide column option.
- ID - The internal ID of the anomaly event.
- Cleared - The date and time at when the anomaly event was cleared.
- IP - The name of the IP associated to the anomaly event.
- Metric Name - it's the specific metric monitored by a host or application. Can be CPU, Memory, Disk, Network .
- Anomaly Score - core value assigned by AD, which determines how unusual the detected behavior in the metric is compared to its history
Insights Table Options
- Show Only Active Insights: a toggle filter to show only the active Insights
- Clear Active Insight: a DataTable row icon to Close/Clear a single Insight
- Clear Active Insight(s): a button to Close/Clear multiple/selected (max 200 at a time) active Insights
- Show/Hide Column: an option to Show/Hide specific DataTable columns
- Export As XLS/PDF: export selected DataTable rows as PDF or Excel document
- Normal/Full-Screen - To toggle between the normal and full screen mode for data table
- GoTo-Top: an option link to navigate to top of the Insights table
- Post a Workbench Data-Center sync, only Active insights will be synced.
Insights Detail View
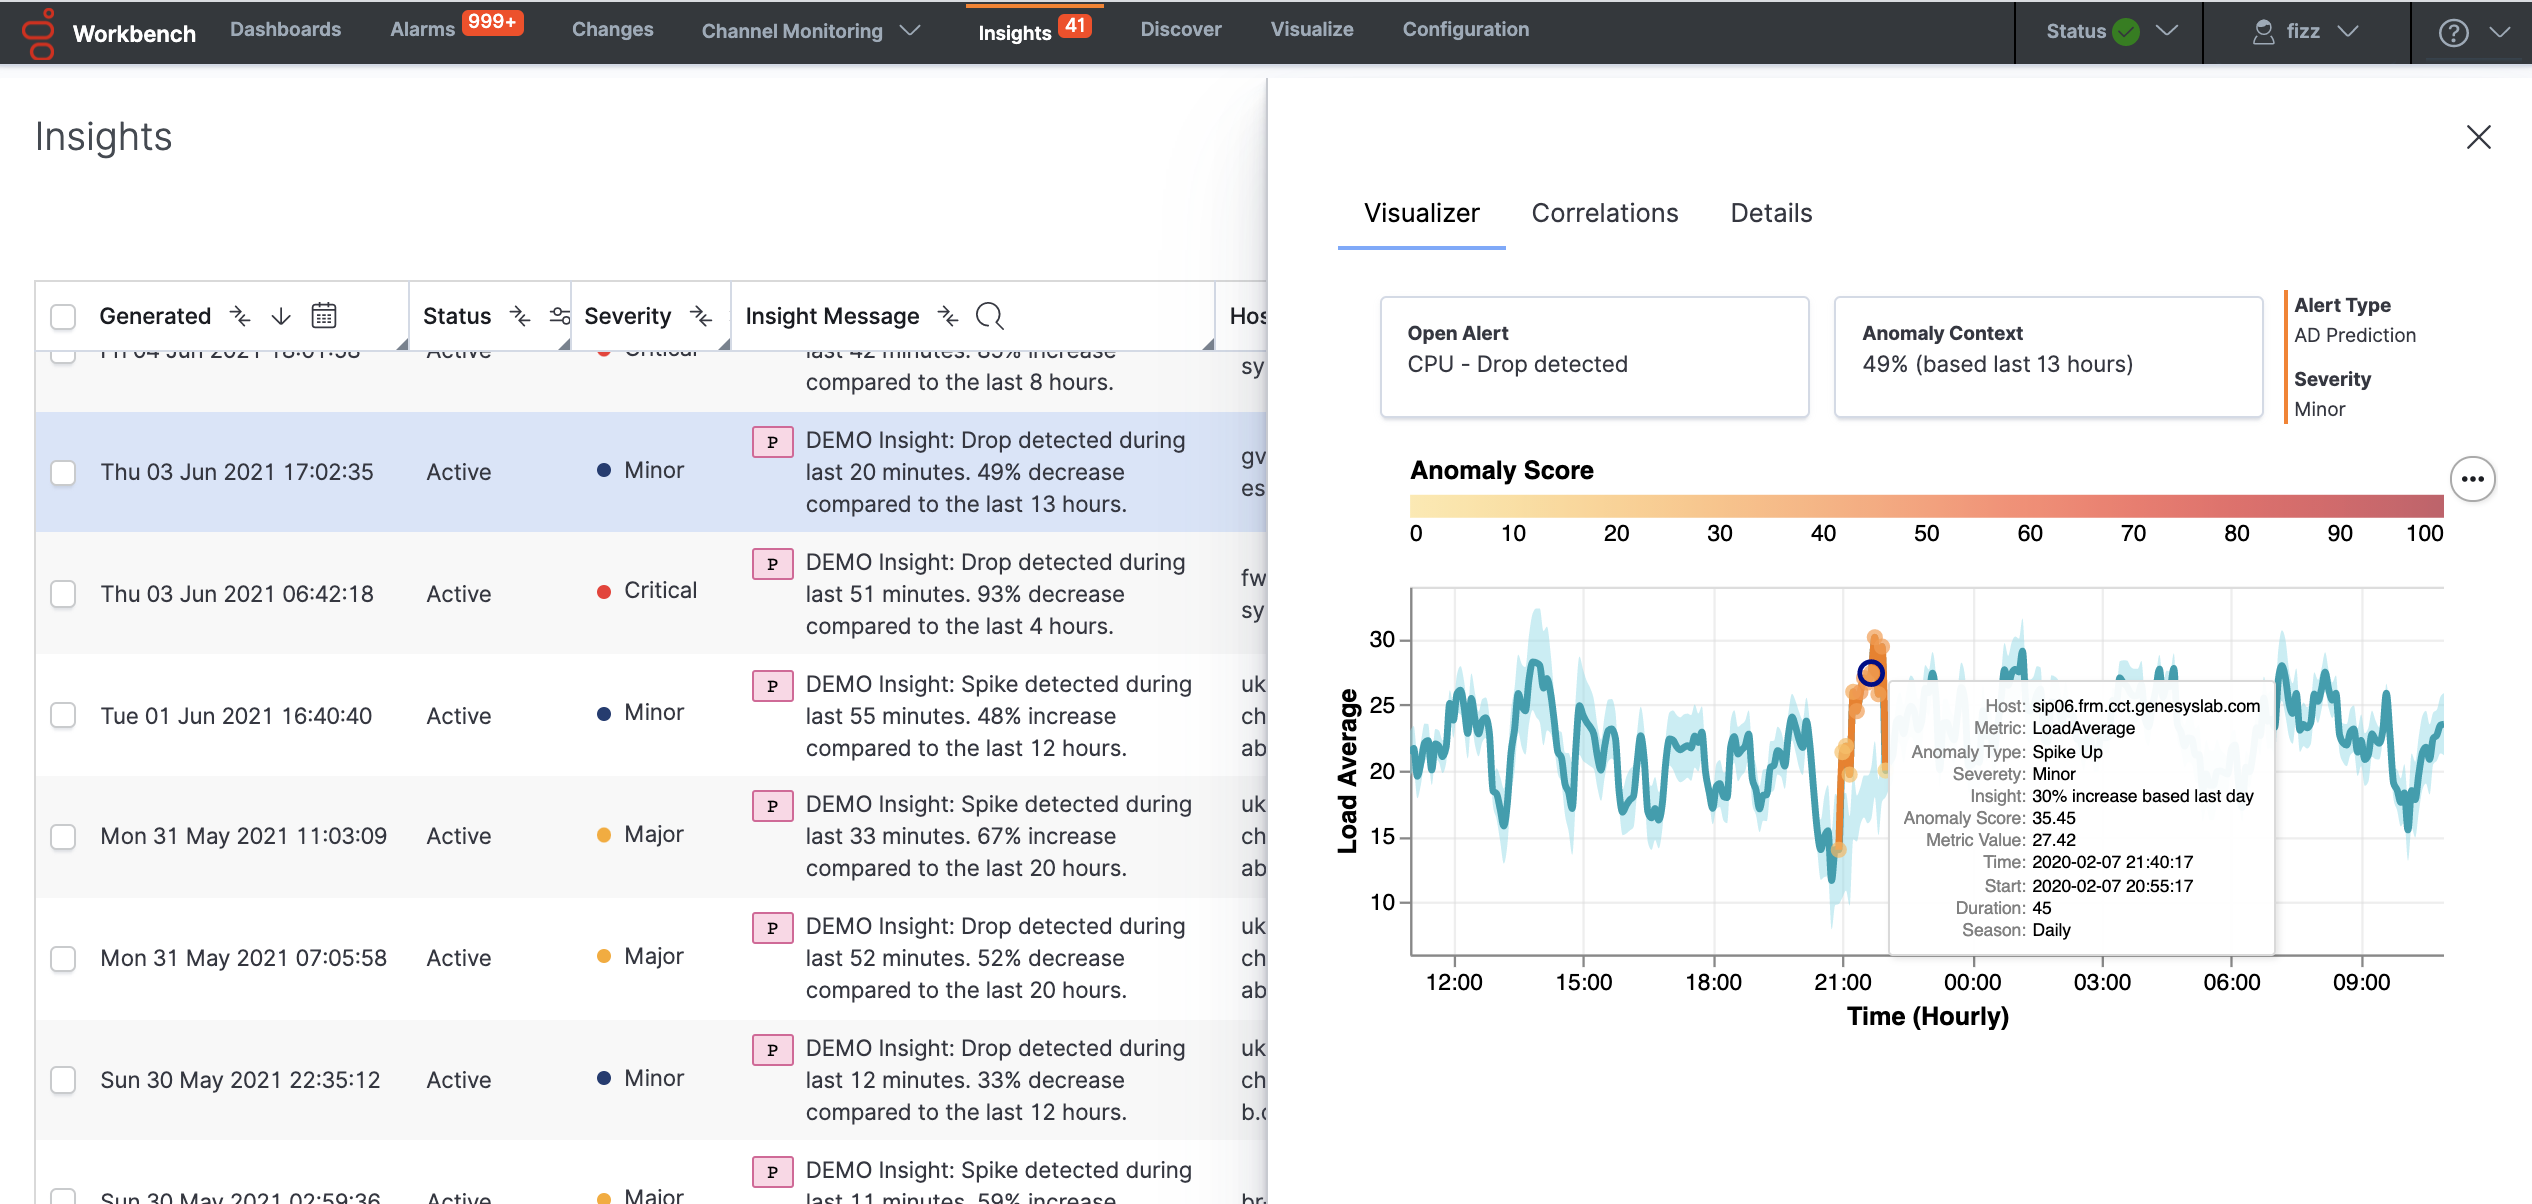
By clicking a particular Insight row in the Data-Table an Insight detail dialog will be presented with Visualizer, Correlations, and Detail tabs.
Visualizer
Display Insights context in graphical view. Main Sections:
- Insight Source: Hostname - metric name
- Insight Context: {anomaly_type} - {anomaly_score} - {duration_time} - {metric_value}
- In case where the Insights have many Anomaly Points; the Anomaly Score is the maximum score for each Anomaly Point.
- Insight duration is defined as the time between the first and last anomaly point in the same hour; when this time is smaller than 15 minutes it will be displayed in seconds.
- Alert Type: AD Insight or AD Prediction
- Severity: Minor, Major or Critical
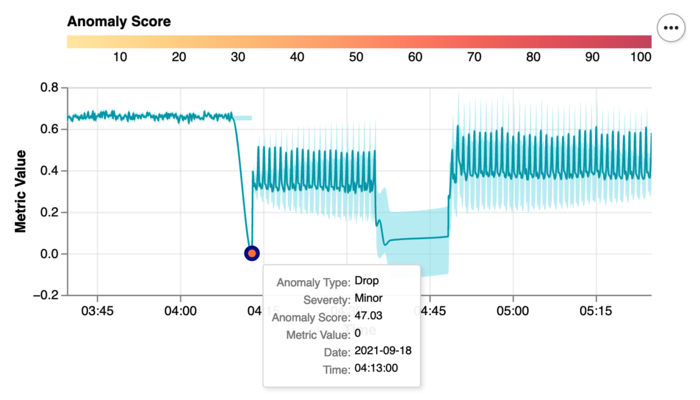
- Anomaly Graph: detailed zoom on anomalies detected.
- Metric Value with information from one hour before and one hour after.
- Normal regions to show commons ranges and variability.
- Anomaly points (circles):anomaly type, severity, anomaly score, metric value, date and time.
- Anomaly Score Legend
AD is able to detect four types of anomalies:
- Spike: is considered as an acute increase in the metric value followed by an immediate return to the underlying level.
- Drop:is considered as an acute decrease in the metric value followed by an immediate return to the underlying level.
- Jitter: is a set of drops and spikes with a duration greater than 15 minutes.
- Trend Prediction: Insights generated based on hourly trend predictions.
- A new insight is generated when high values are (> 95%) predicted in the next hours [0 - 72 hours]
- Score give an indication of the metric rate of change.
- Because these insights are based on predictions, these don't have time correlations with other insights.
- Alert Type: AD Prediction
- A P icon is used in Insights Table to easily identify.
Correlations
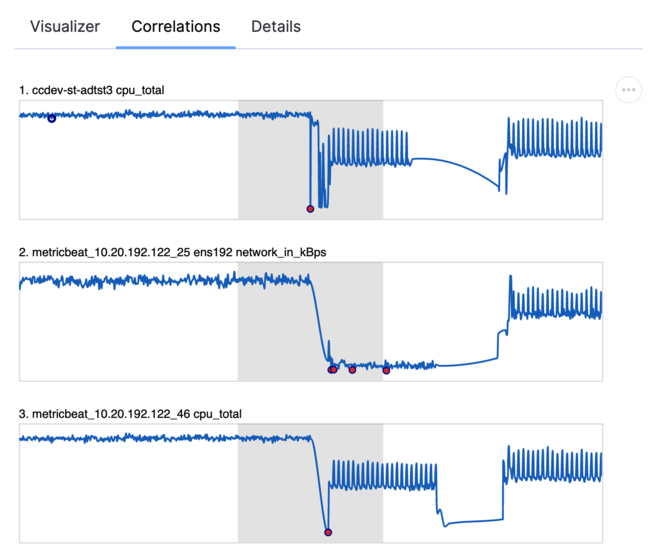
Help to analyze time correlation details between insights:
- Different insights are correlated in a time frame of 30 minutes (gray region).
- A maximum of 5 correlated metrics are visualized.
- Each graphic as a title has the source: host name and metric name.
- For each metric are visualized the anomaly points as red circles.
- All graphics extends between one hour before the correlation region and one hour after.
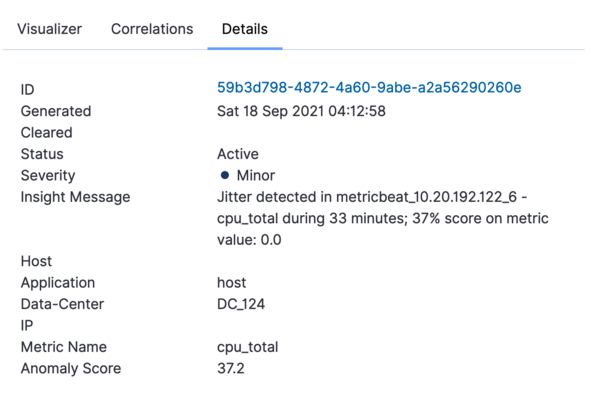
Details
Display table row information in vertical order:
- ID
- Generated date: Fri 24 Sep 2021 16:17:54
- Cleared date (empty for active insights)
- Status
- Severity
- Insight Message
- Host
- Application
- Data-Center
- IP
- Metric Name
- Anomaly Score
AD Insight Alarms
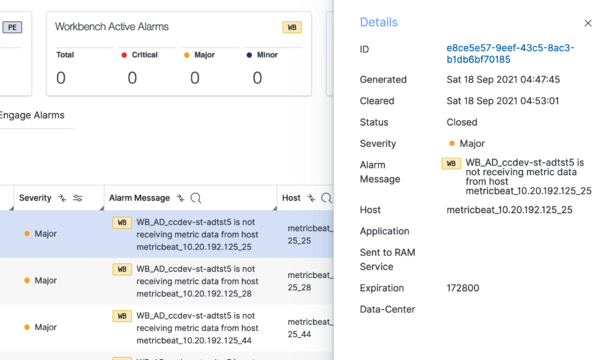
AD Alarms are part of Workbench Alarms in WD UI. AD automatically control the status for each alarm generated: continuously each alarm is monitored to be closed. These alarms have an hierarchical behavior: when an alarm is generated, automatically all below that are closed. AD can generate four types of alarms:
1. AD is not able to connect with Workbench Logstash.
- Severity: Critical
- Structure: {ad_appname} is not able to connect with Logstash {logstash_host}
- Suggested Actions: validate if Logstash configuration in both, AD and Logstash are properly. Check if Logstash Node is down or is restarting.
2. AD is connected to Workbench Logstash but is not receiving metric data.
- Severity: Critical
- Structure: {ad_appname} is not receiving metric data from Logstash
- Suggested Actions: validate if Logstash is receiving data from Metricbeats or all Metricbeats are down.
3. AD is not receiving data from a particular workbench host
- Severity: Major
- Structure: {ad_appname} is not receiving metric data from host {hostname}
- Suggested Actions: validate if that specific host is down.
4. There is an additional type of Alarm generated when an AD node is down.
- Severity: Critical
- Structure: AD Node {ad_node_name} is down
- Suggested Actions: validate if that specific host is down.

