Contents
Workbench Dashboards
Workbench Dashboards are a placeholder for a collection of "Visualizations" that display health, status and event data.
Workbench Dashboards provide at-a-glance insights into data that has been ingested from your Genesys Engage platform as well as Workbench related data/events.
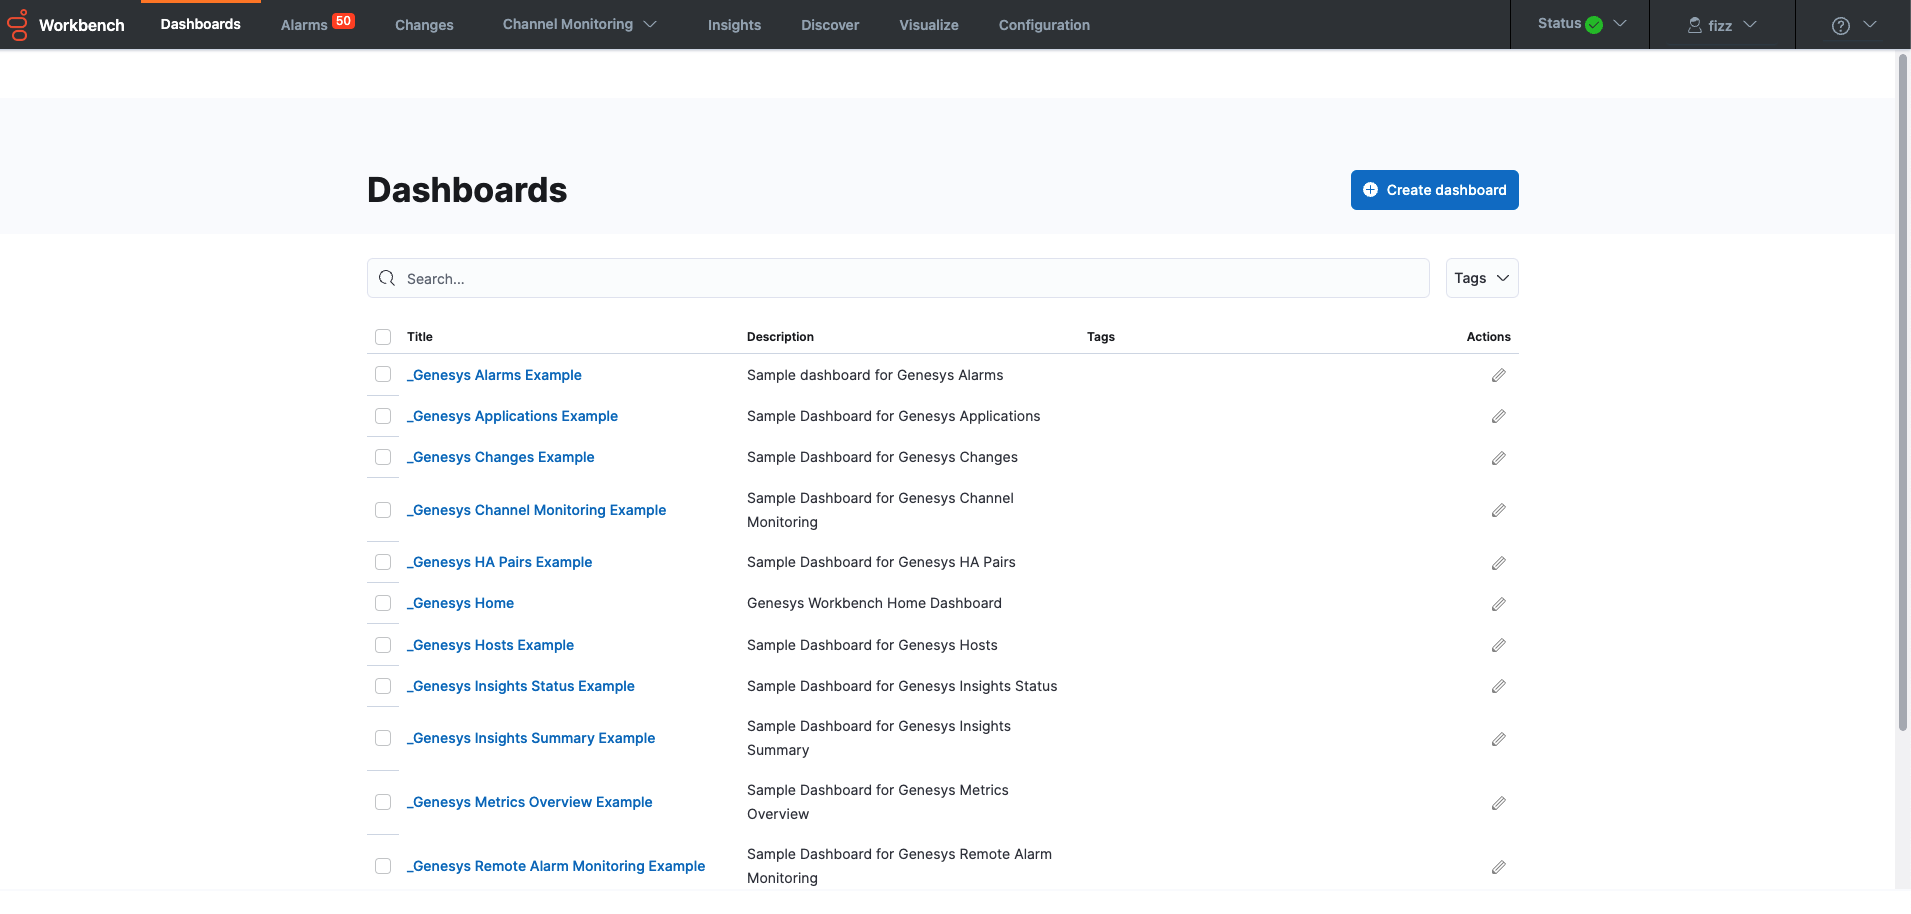
To view and use Workbench Dashboards, click Dashboards on the Workbench top navigation bar; post installation Dashboards (13) contain shipped examples to view and use, detailed below:
Dashboard Functionality
With Workbench Dashboards you can:
- Create new Dashboards
- Search for Dashboards
- Share Dashboards
- Clone/Copy Dashboards
- Edit/Customize Dashboards
- Full-Screen Dashboards
- Arrange Visualizations within the Dashboards.
- Gain monitoring and troubleshooting insights from the shipped Dashboards and newly created Dashboards.
- Use and learn from shipped example Dashboards.
- View the shipped Visualizations within the shipped Dashboards.
Genesys Home Dashboard
Workbench ships with a "_Genesys Home" Dashboard concept.
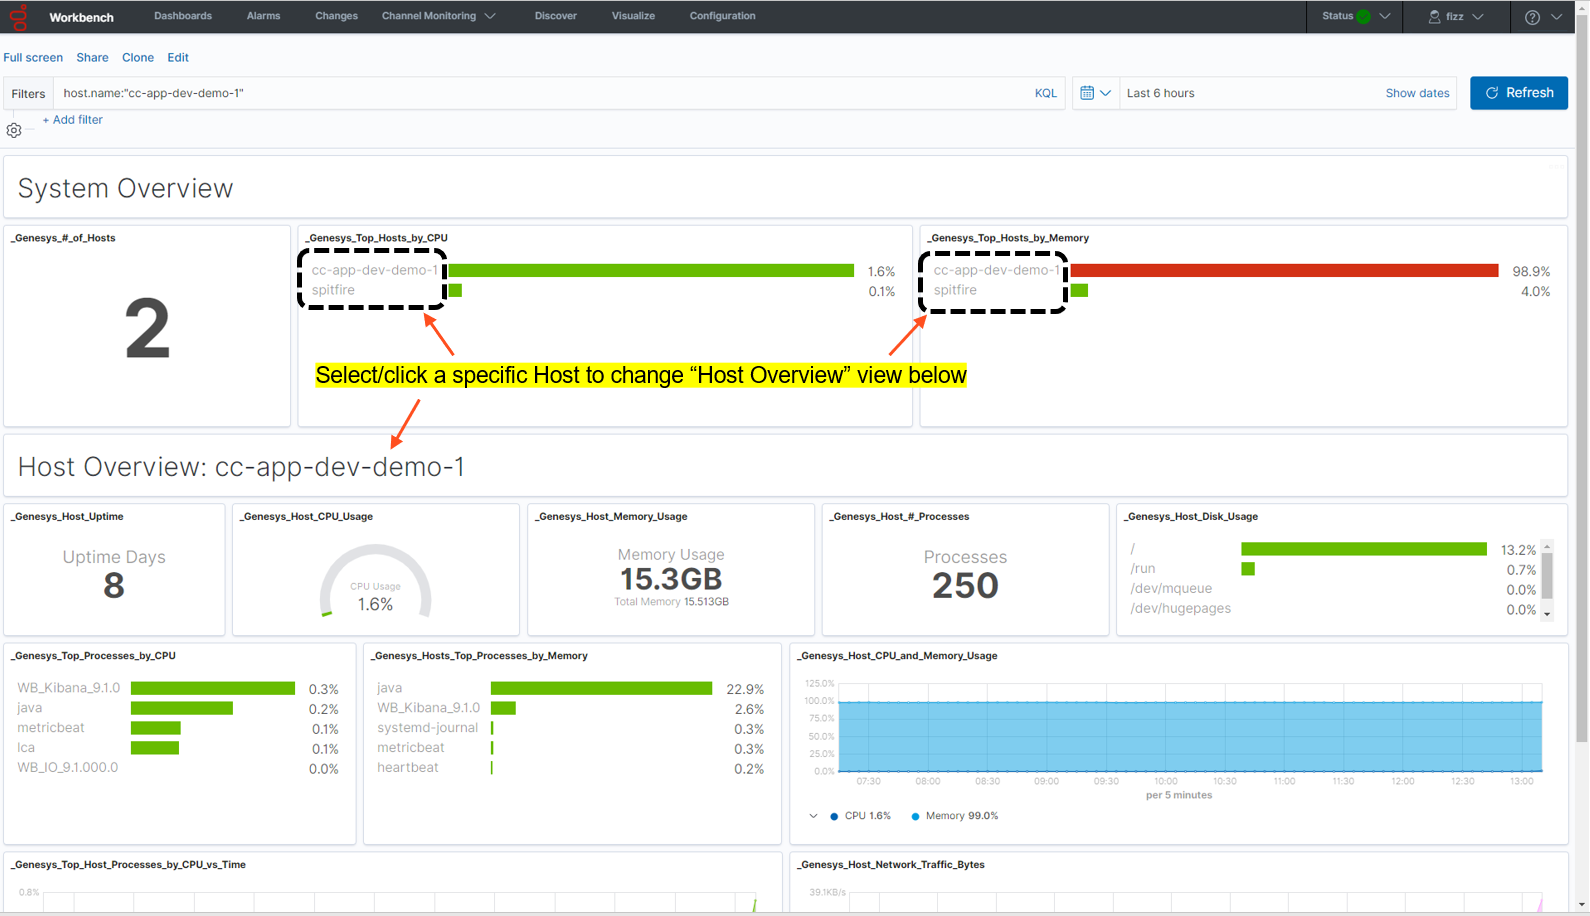
In Workbench 9.3 the default home dashboard is the "_Genesys Metrics Overview Example" which provides details of:
- Number of Hosts
- Top Hosts by CPU
- Top Hosts by Memory
- Host(s) Uptime
- Host(s) CPU Usage
- Host(s) Memory Usage
- Host(s) # of Processes
- Host(s) Disk Usage
- Top Processes by CPU
- Top Processes by Memory
- Host(s) CPU and Memory Usage
- Top Host(s) Processes by CPU vs Time
- Host(s) Network Traffic Bytes
- The "_Genesys Metrics Overview Example" will display Hosts that are ingestion Metric data into the Workbench solution; including the Workbench Hosts
- Workbench Agent Remote (WAR) components need to be installed on remote hosts such as sip, urs, gvp etc for Workbench to show their respective data
Dashboard Examples
Workbench ships with the following example Dashboard templates:
- _Genesys Alarms Example
- _Genesys Applications Example
- Note: Workbench only monitors Server Type applications and not Client applications; therefore the Total/Up/Down/Unknown counts may be different from GAX and GA
- _Genesys Changes Example
- _Genesys Channel Monitoring Example
- _Genesys HA Pairs Example
- _Genesys Home
- _Genesys Hosts Example
- _Genesys Insights Status Example
- _Genesys Insights Summary Example
- _Genesys Metrics Overview Example
- _Genesys Remote Alarm Monitoring Example
- _Genesys Solutions Example
- _Genesys Workbench Summary Example
Metrics Overview Example Dashboard
Workbench 9.1 adds a Metric data ingestion feature that enables observability of host and process CPU, Memory, Disk and Network metric data, providing rich insights and analysis capability into host and process metric utilization, performance and trends.
Considerations
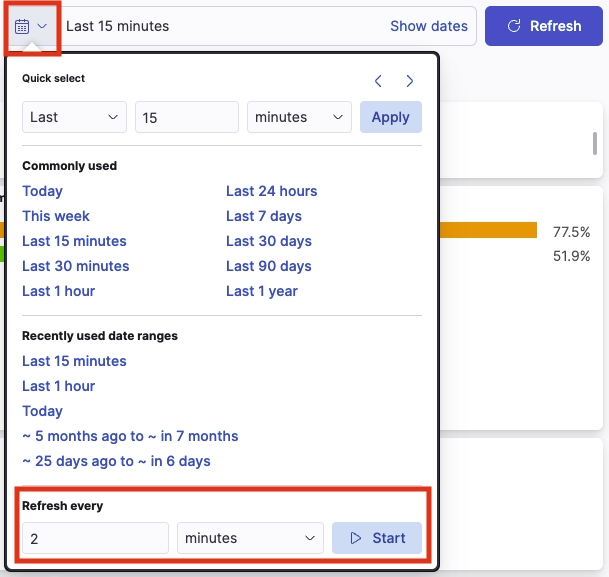
- From WB 9.3+ the Dashboards/Visualizations do not update by default in real-time
- Use the 'Quick Select' feature below to 'Start' auto Refresh functionality of Dashboards/Visualizations
- For Workbench 9.2 to 9.3 upgrades, existing Dashboards/Visualizations will be migrated with a "_9.2" suffix
- The migrated "_9.2" Dashboards/Visualizations will not be functional given the changes from Kibana 7.1 to 7.17
- As such, when opening the migrated "_9.2" Dashboards/Visualizations, a Warning icon/message will be displayed
- Even though the migrated "_9.2" Dashboards/Visualizations are not functional and display a Warning, the logic for migrating is to provide context for previously created Dashboards/Visualizations
- Workbench Dashboards and Visualizations leverage the Elastic Kibana component, please review the Kibana documentation (https://www.elastic.co/kibana) for further comprehensive guidance on Dashboards and Visualizations.


