Workbench Discover Console
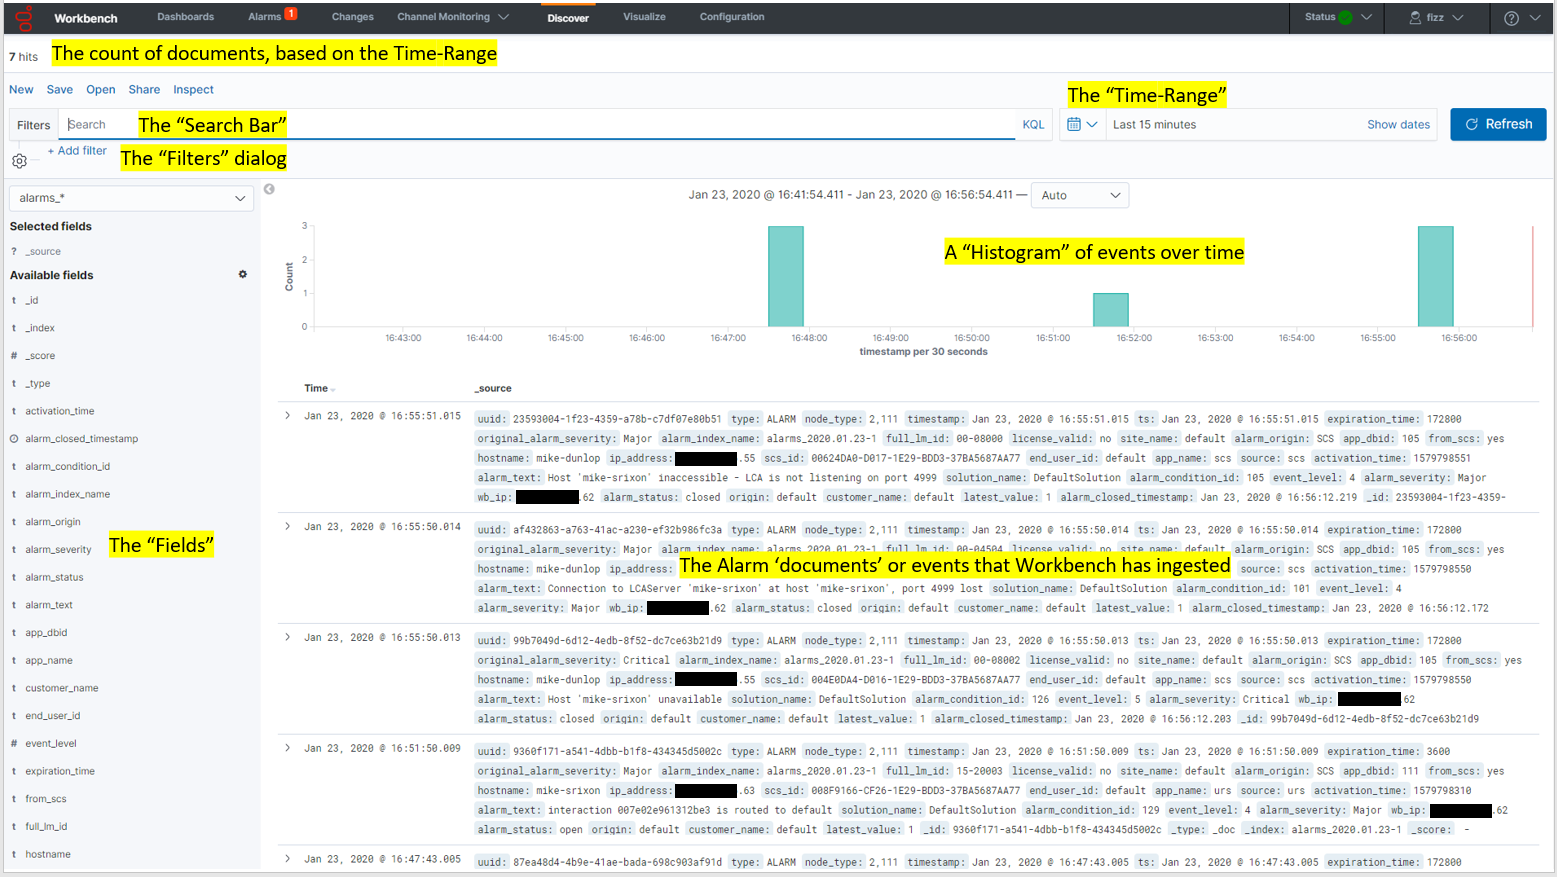
The Workbench Discover Console allows the user to explore and visualize the raw data events ingested into Workbench.
Use the Discover Console to:
- View and analyze raw ingested document data for a given time range
- Submit searches via the "Search bar"
- Add Filters based on the fields in the document
- View the count of ingested documents over time via the top histogram
Discover Console Examples
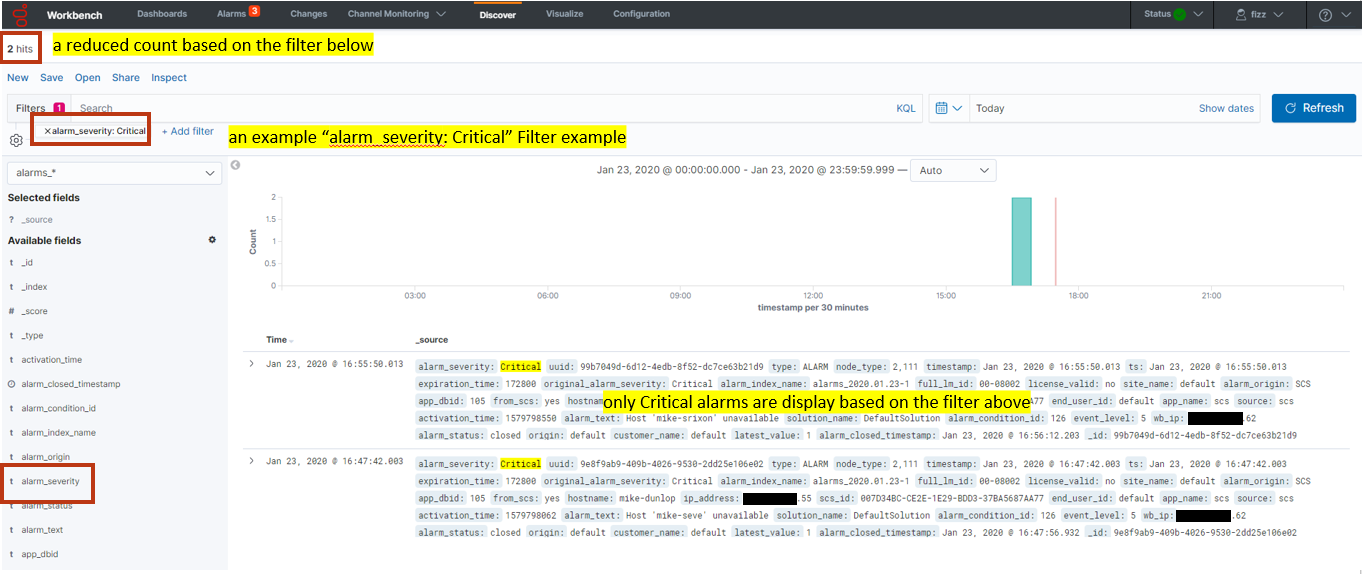
An example Discover output with an alarm_severity: Critical filter applied:

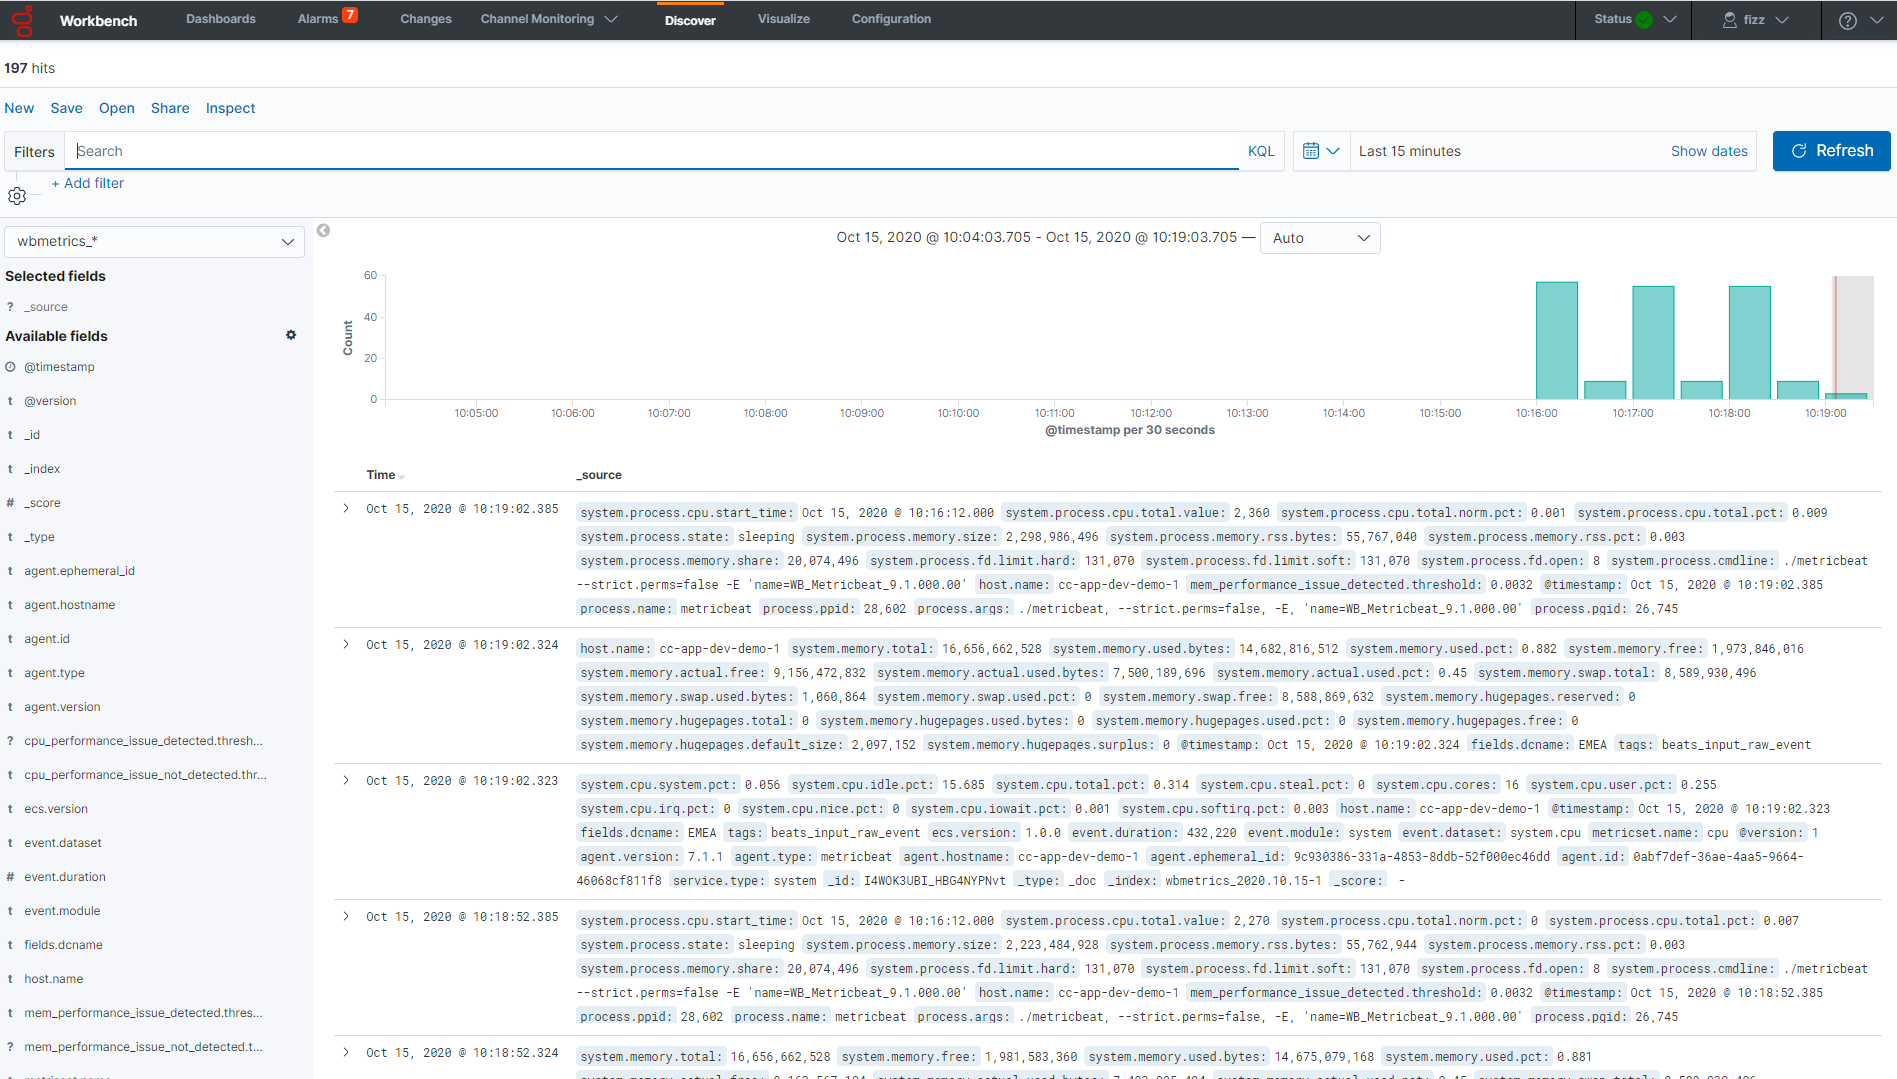
An example Discover output with the "wbmetric_*" ingested data:

An example Discover output with a "system.process.memory.rss.pct > 0.2" filter and specific fields selected:

This page was last edited on December 24, 2020, at 17:38.
Comments or questions about this documentation? Contact us for support!

