Contents
AD Visualizations
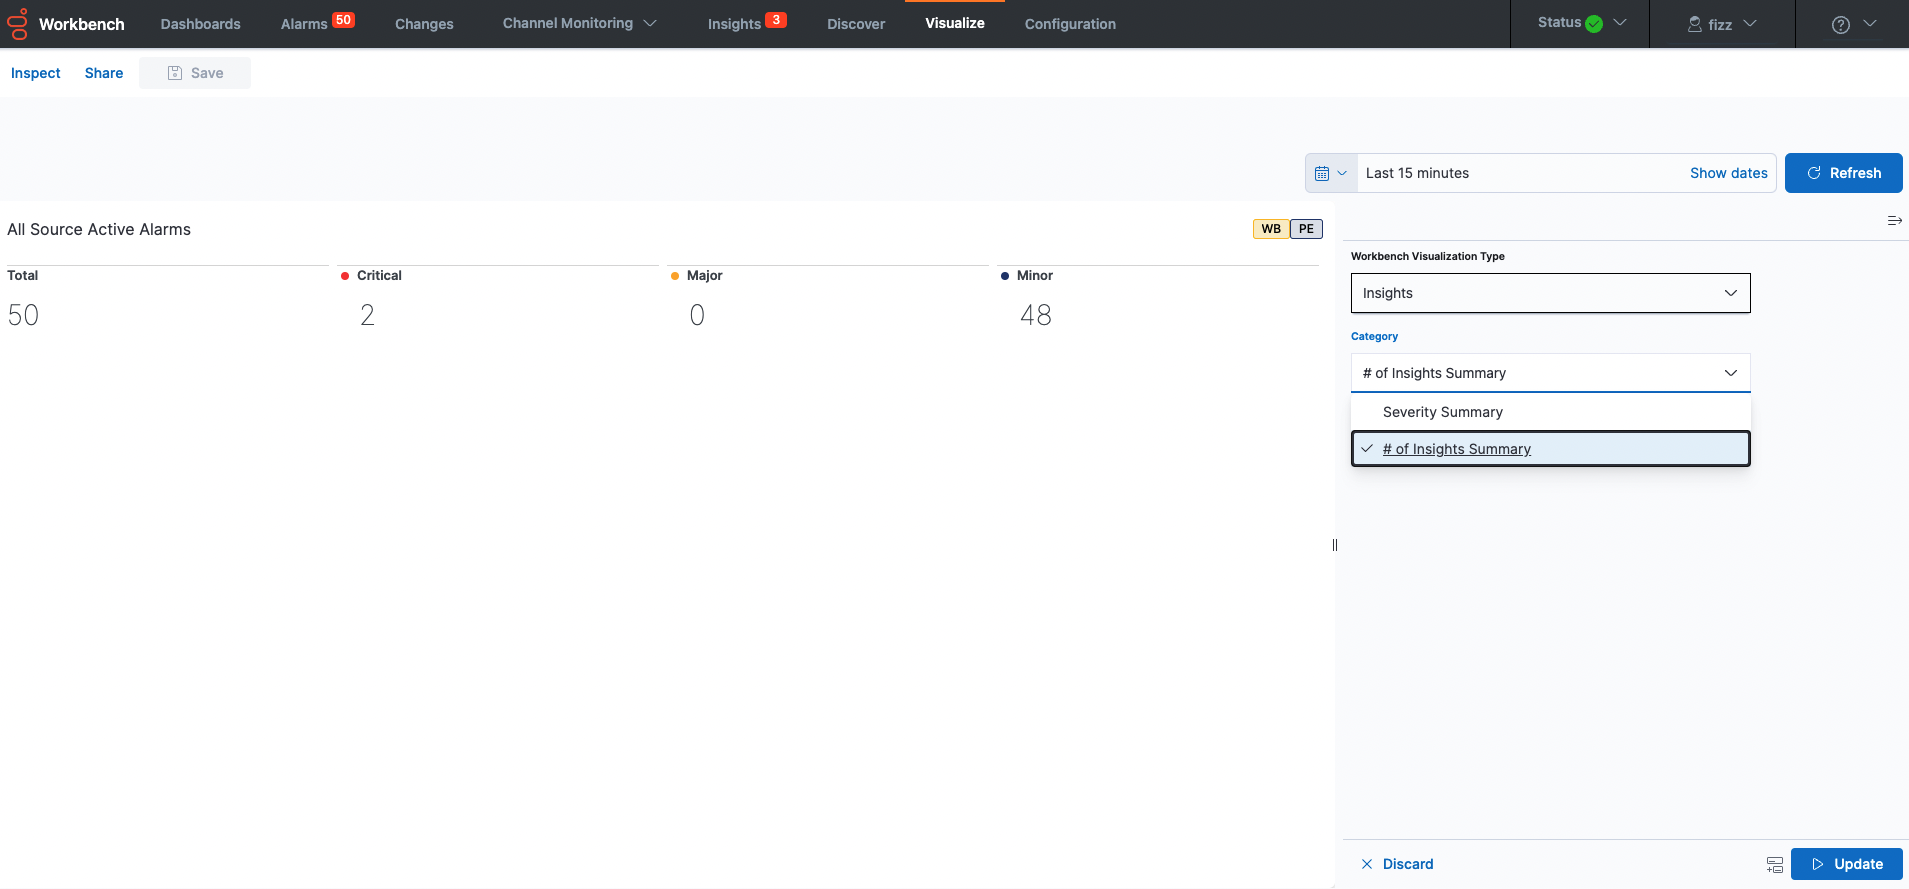
The AD Insights feature enables the following additional real-time Visualizations under Genesys General Type.
- _Genesys_#_of_Insights_Summary
- _Genesys_Insight_Summary
- _Genesys_Insights_Status
_Genesys_#_of_Insights_Summary Visualization
This Vizualization displays the real-time Statistical Summary of detected Insights/Anomalies; in a Today, Yesterday, This Week, Last Week, and This Month and Last Month format.
_Genesys_Insight_Summary Visualization
This real-time Visualization displays Active Insights/Anomalies Summary details; in a Critical, Major, Minor format.
Note: ![]() - Critical,
- Critical, ![]() - Major,
- Major, ![]() - Minor
- Minor
_Genesys_Insights_Status Visualization
This real-time Visualization displays Active Status (i.e. Up/Down) of the AD components/applications.
Considerations
Important
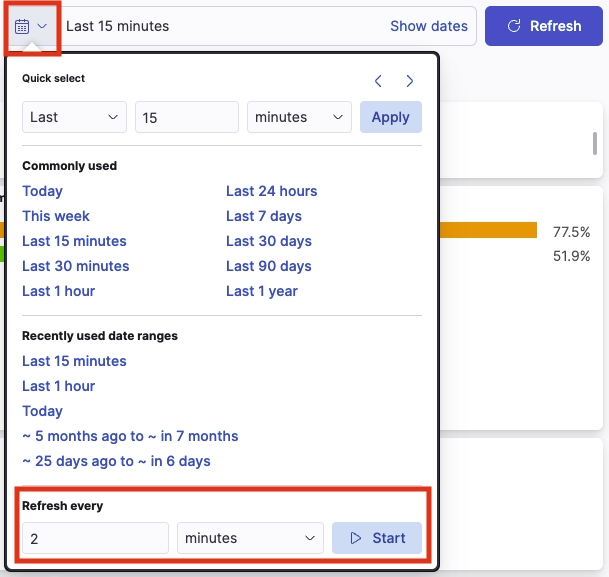
- From WB 9.3+ the Dashboards/Visualizations do not update by default in real-time
- Use the 'Quick Select' feature below to 'Start' auto Refresh functionality of Dashboards/Visualizations
Important
- For Workbench 9.2 to 9.3 upgrades, existing Dashboards/Visualizations will be migrated with a "_9.2" suffix
- The migrated "_9.2" Dashboards/Visualizations will not be functional given the changes from Kibana 7.1 to 7.17
- As such, when opening the migrated "_9.2" Dashboards/Visualizations, a Warning icon/message will be displayed
- Even though the migrated "_9.2" Dashboards/Visualizations are not functional and display a Warning, the logic for migrating is to provide context for previously created Dashboards/Visualizations
Important
- For further comprehensive guidance on creating your own Vizualizations, please review the Visualizations section
This page was last edited on June 22, 2022, at 08:47.
Comments or questions about this documentation? Contact us for support!


