Contents
CM - Reports
The Channel Monitoring Reports page provides historical insights into the Call Flow tests, their specific behavour and results.
Please use the following steps to use CM Reports:
- Select Channel Monitoring > Reports from the Workbench top navigation bar.
- The CM Report page is presented
- Select a Call Flow from the Call Flow Name drop-down list
- The CM Report is generated and data is displayed for a time-range of the current day (i.e. "Today")
- If needed, from the Time Range drop-down, select a different timescale (i.e. "This Week" or "This Month" or "Last 15 Minutes")
- If/when the Time Range is changed, click the Refresh button to update the data
CM Reports Content
CM Reports contains 4 tabs:
- Call Metrics
- Stage Results
- Call Results
- Call Details
Each in the CM Reports section provides a different view of the available data on the selected Call Flow.
Call Metrics Report
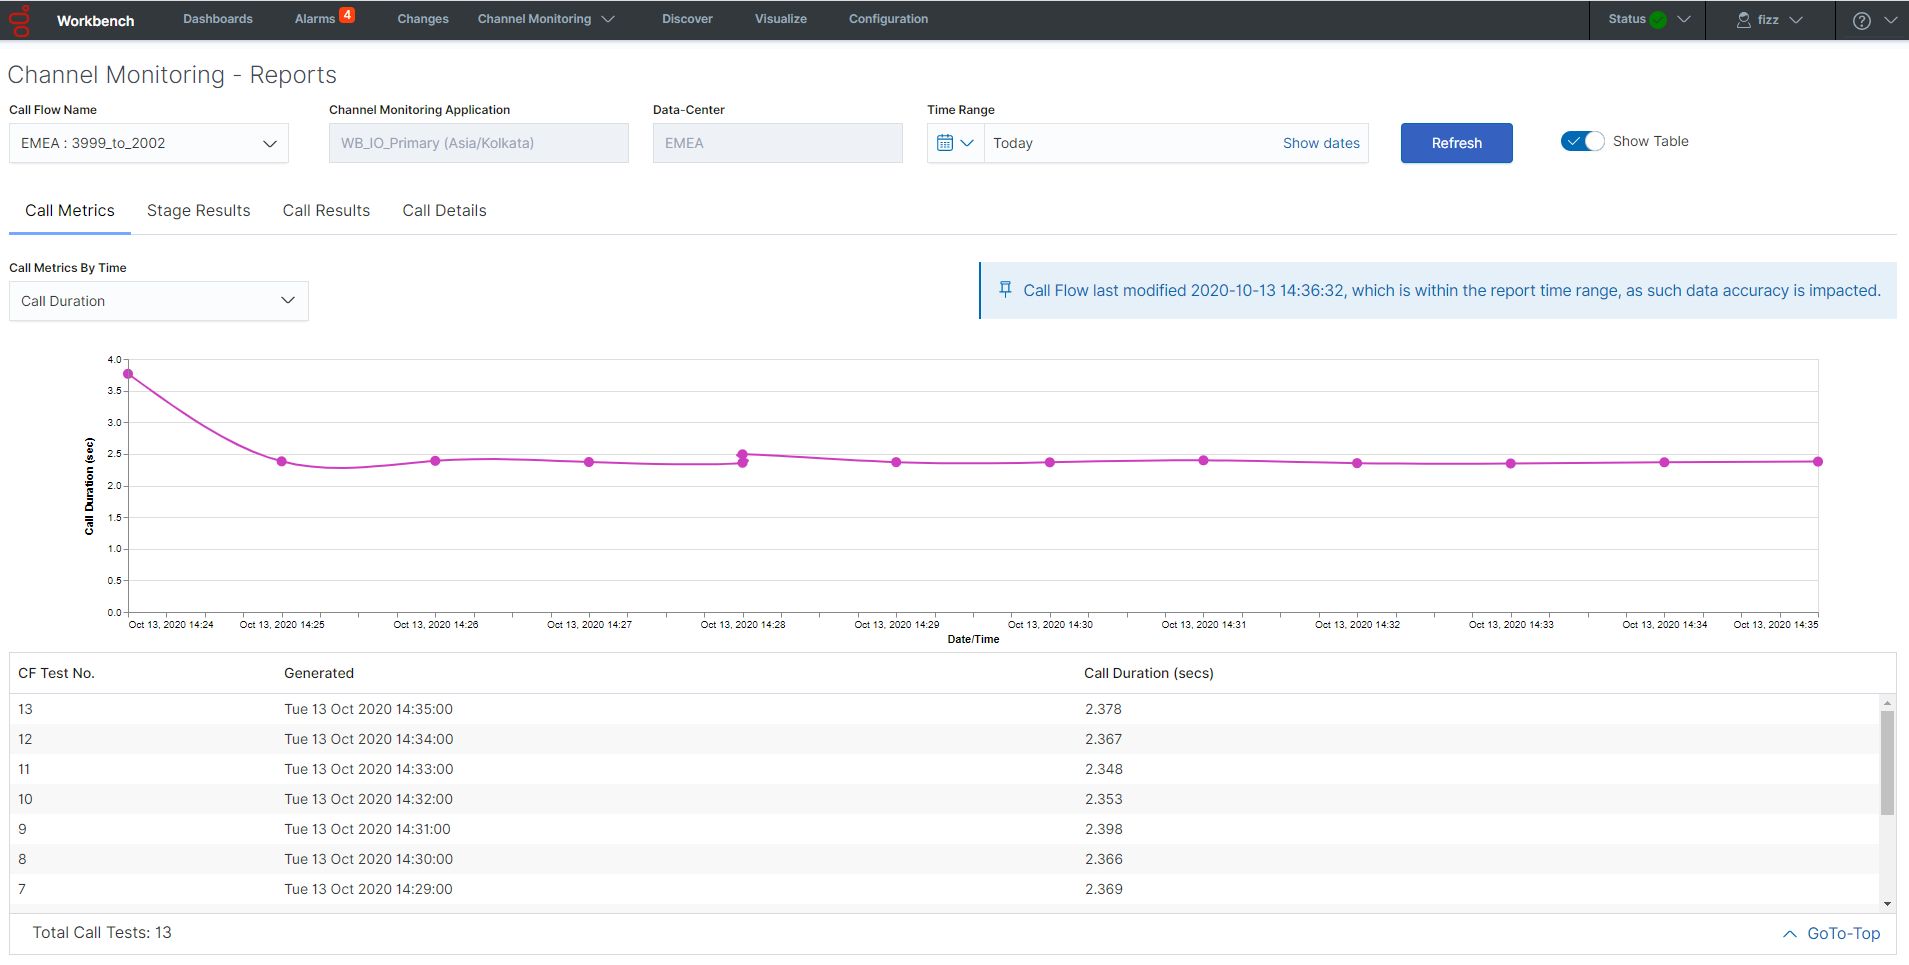
The Call Metrics report uses a graph and table to describe the behavior of a Call Flow in time.
The horizontal axis shows the date/time in which individual calls were executed.
The vertical axis can be modified on the dropdown list to change the metric (Call Duration, Jitter, Time Wait for Agent) used to analyze the call.
The Jitter and Time Wait for Agent metrics have three thresholds that can be configured in the Alarms section of the Call Flow configuration (see CM - Call Flow Alarms); the threshold for each severity (Critical, Major, Minor) is shown in the graph as a different horizontal line.
The available Call Metric Report Metrics are:
Call Duration
The length of the call in seconds. The duration is measured from the moment Channel Monitoring starts the call (i.e., sends the first SIP invite message), until the call is finished because it either encounters an error or ends as expected.
Wait Time for Agent
The amount of time in minutes between the start of the transfer to an agent, and the moment when the agent answers the call.
Jitter
A measure of the quality of the call. In the context of Channel Monitoring, jitter is understood as “the variation of a signal with respect to some clock signal, where the arrival time of the signal is expected to coincide with the arrival of the clock signal.” In this case, the signal refers to the RTP packets downloaded to Channel Monitoring, and the clock signal is the RTP clock rate for the media stream. Jitter is measured in milliseconds.
The quoted jitter definition above is from Internet Engineering Task Force (IETF) RFC 3393: IP Packet Delay Variation Metric for IP Performance Metrics (IPPM), page 2, retrieved from https://tools.ietf.org/html/rfc3393.
Stage Results Report
This section shows the different outcomes per Stage of a Call Flow.
The report aggregates all the Stage results across the different calls for the given Call Flow.
For example, if a call fails while sending audio because of an unexpected hang-up, this will increase the count for Unexpected Hang-Ups during that specific send media stage.
The available Stage Results are:
Success
All stages were executed and their results were as expected.
Pending Result
The call has finished and is being analyzed to determine if it failed at some point of its execution or if it’s a success. Even though most results are determined in real-time during the execution of the call, some could be delayed to the end of the call (such as media analysis).
Registrar Connection Failed
The SIP account used by Channel Monitoring to make calls could not connect to SIP Server. This would usually occur during the “Start Call” stage when Channel Monitoring tries to reach SIP Server. Possible causes include problems trying to resolve the domain name or IP address of SIP Server.
Account Authentication Failed
The SIP account used by Channel Monitoring to make calls could not authenticate against SIP Server using the provided credentials. This would usually occur during the “Start Call” stage when Channel Monitoring tries to register the account in SIP Server.
Unexpected Hang-up
The call was being executed and it stopped in an unexpected moment. Calls should end (hang-up) during the “End Call” stage and the “Wait for Agent” stage when the initial call is replaced because of the transfer to the agent. If the call ends at any other stage, it will be considered an unexpected hang-up.
No Answer
Channel Monitoring was not able to reach the target DN and complete the Start Call transaction after a given timeout. This could occur during the “Start Call” stage as Channel Monitoring tries to set up the call with the System Under Test.
Media Analysis Failed
Media received during the call did not match the expected media. A call could have various “Receive Media” stages where audio is received and then analyzed to determine if it matches the expected audio. This comparison produces a percentage error that, when high enough, will produce this error.
No Answer from Agent
A transfer to an agent was expected to occur but no provided DN answered the call before the given timeout. In this case, Channel Monitoring waits for the call to get transferred to one of the DNs provided during the call flow creation. The call might get transferred but it will only be successful if the target of the transfer is contained in the list of DNs set up by the user while configuring the “Wait for Agent” stage.
Call Results Report
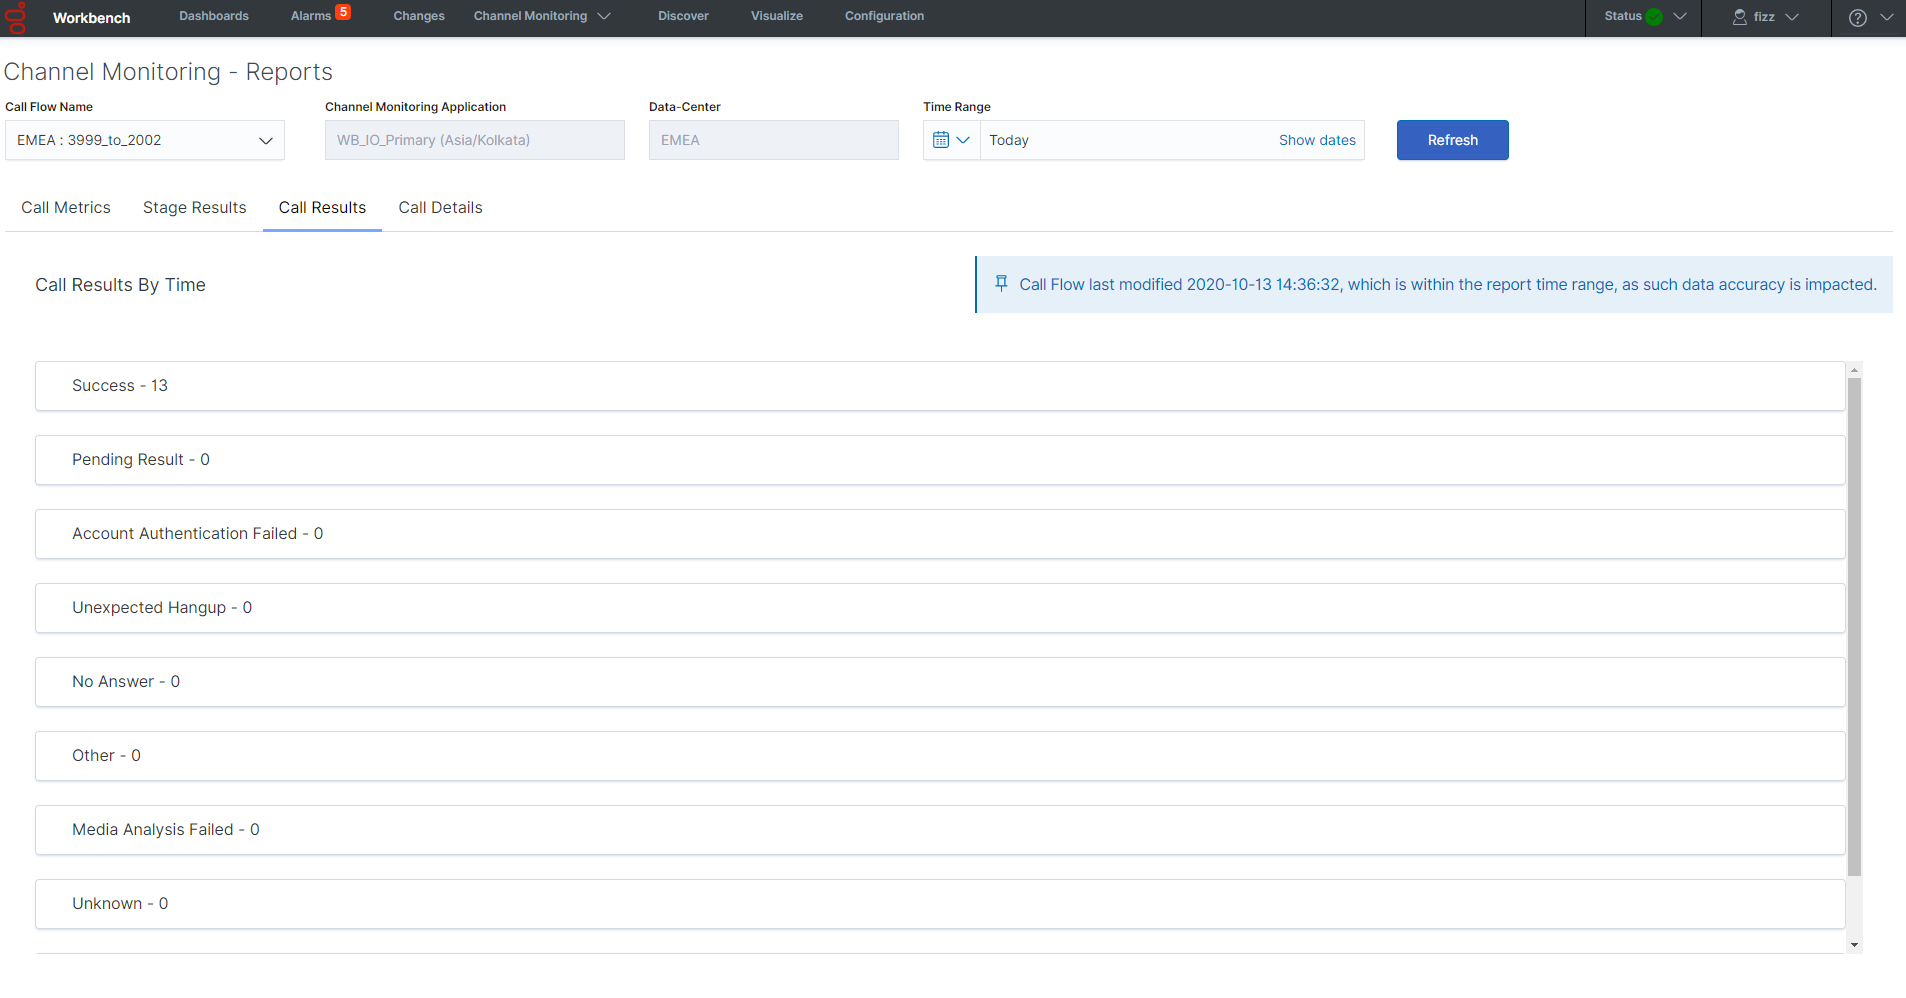
The Call Results report presents the overall outcome for the calls placed against the Call Flow and the number of times each outcome has occurred.
The possible Call Results are:
- Success
- Pending Result
- Account Authentication Failed
- Unexpected Hangup
- No Answer
- Other
- Media Analysis Failed
- Unknown
- No Answer From Agent
Call Details Report
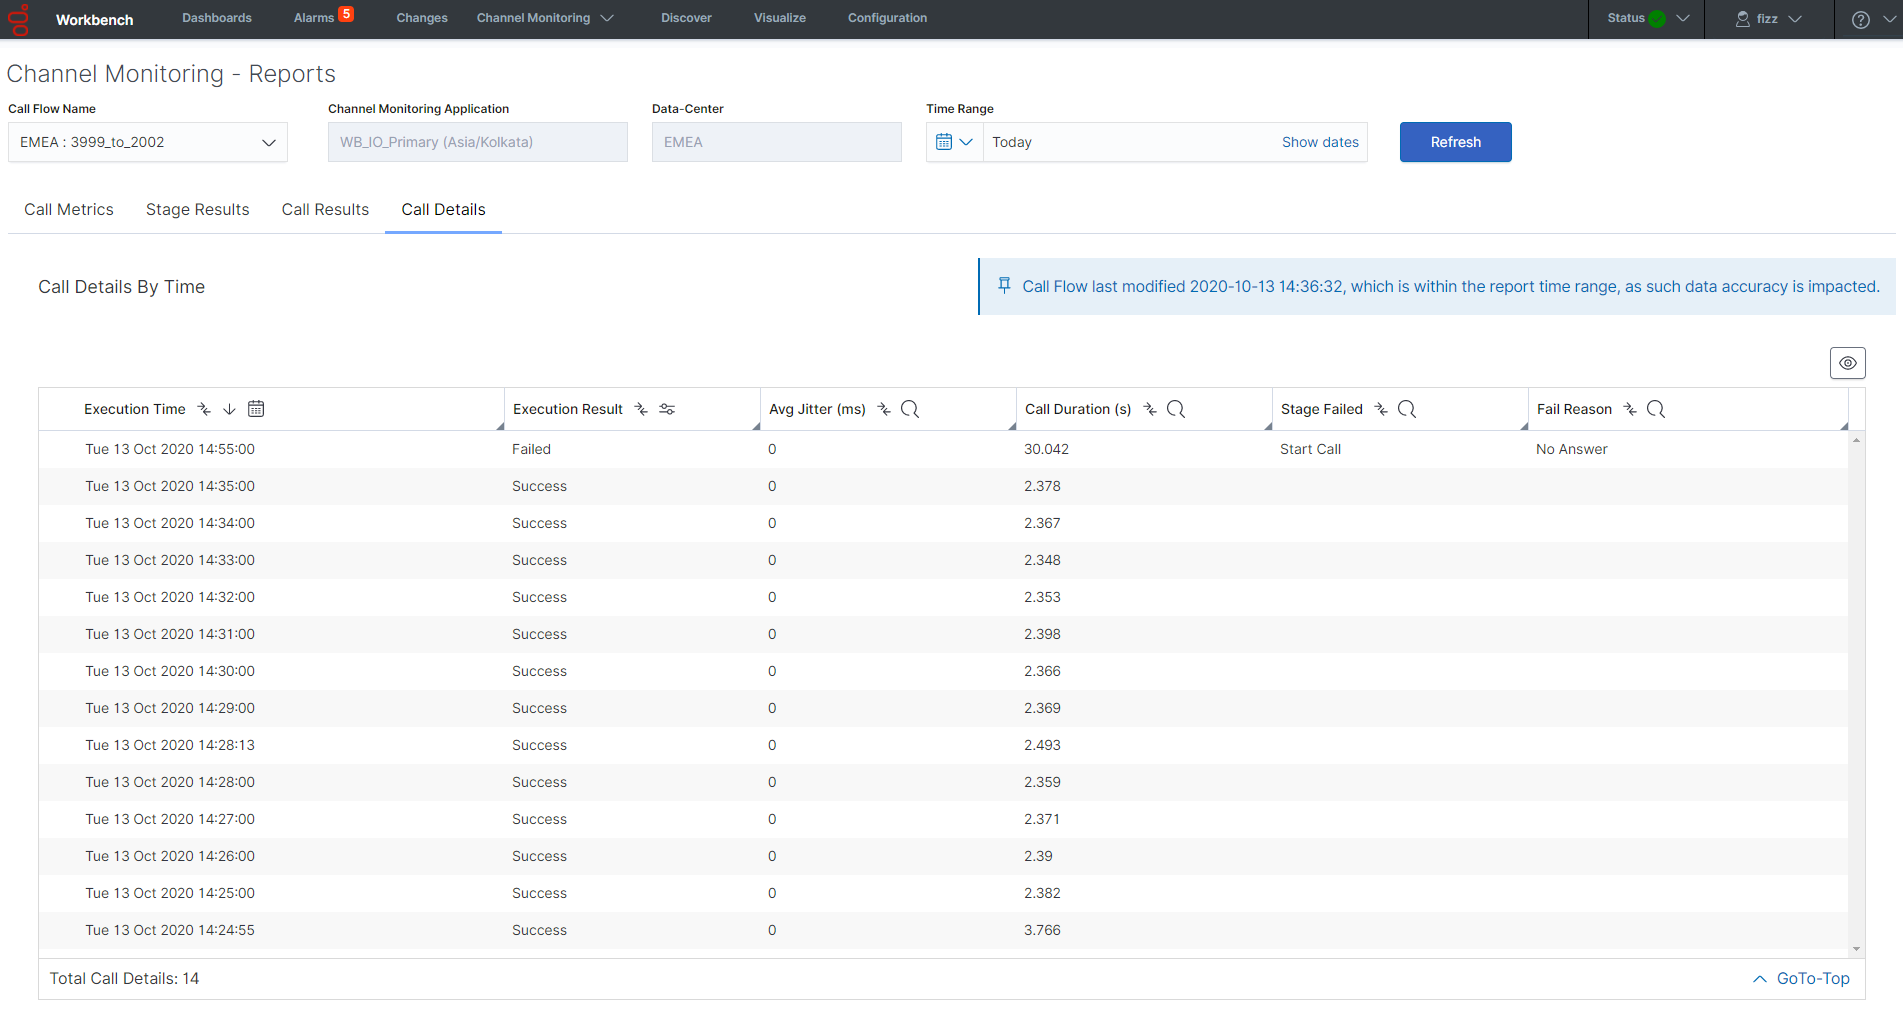
This report uses a tabular view to present various properties of the test calls. Each row represents the execution of a single call from the repsecitve Call Flow.
The possible execution results for a call are “Success” and “Fail”; if the call Failed, the table will show the Stage in which it failed and the reason for the error.


