Contents
AD Dashboards
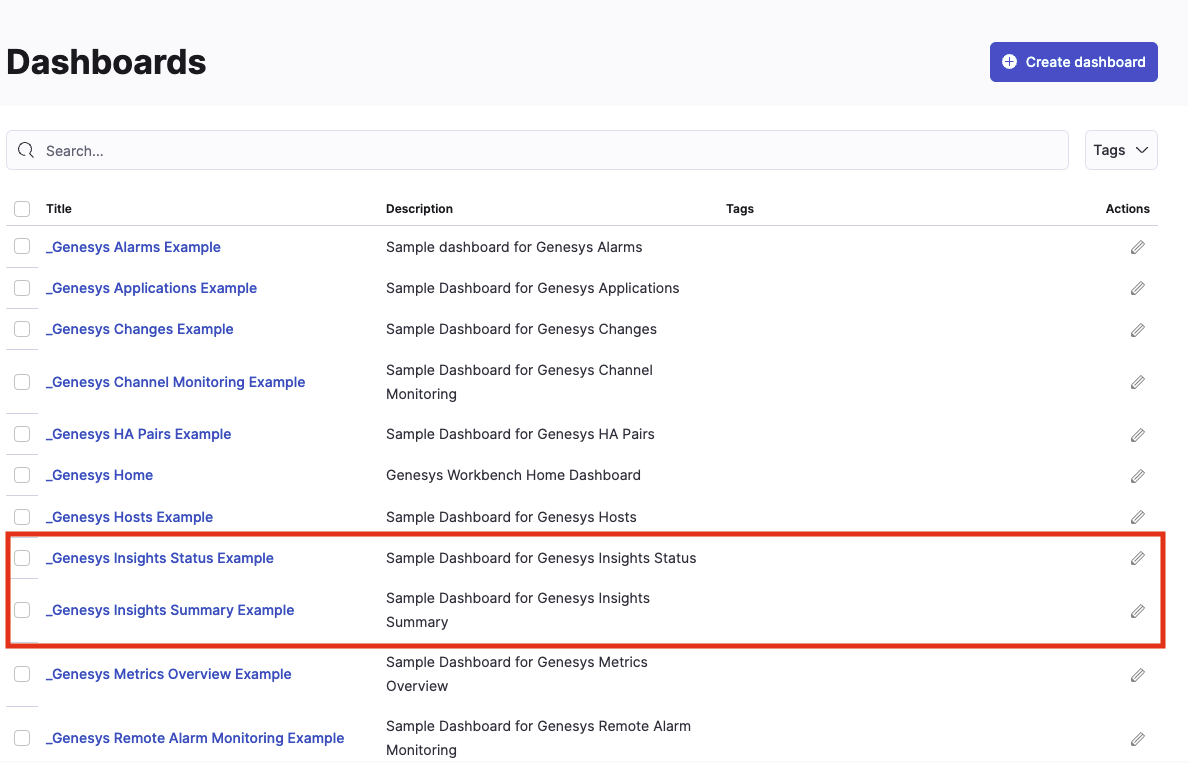
Installing the Workbench Anomaly Detection feature enables two additional example Dashboards in Workbench.
These example Dashboards provide an at-a-glance view of AD Insights Summary and AD Component Status details.

_Genesys Insights Summary Example Dashboard
This example dashboard includes the following real-time Visualizations:
- _Genesys_Insights_Summary - a view of Active Critical, Major and Minor Insights
- _Genesys_#_of_Insights_Summary - a view of Insights raised Today/Yesterday, This Week/Last Week and This Month/Last Month
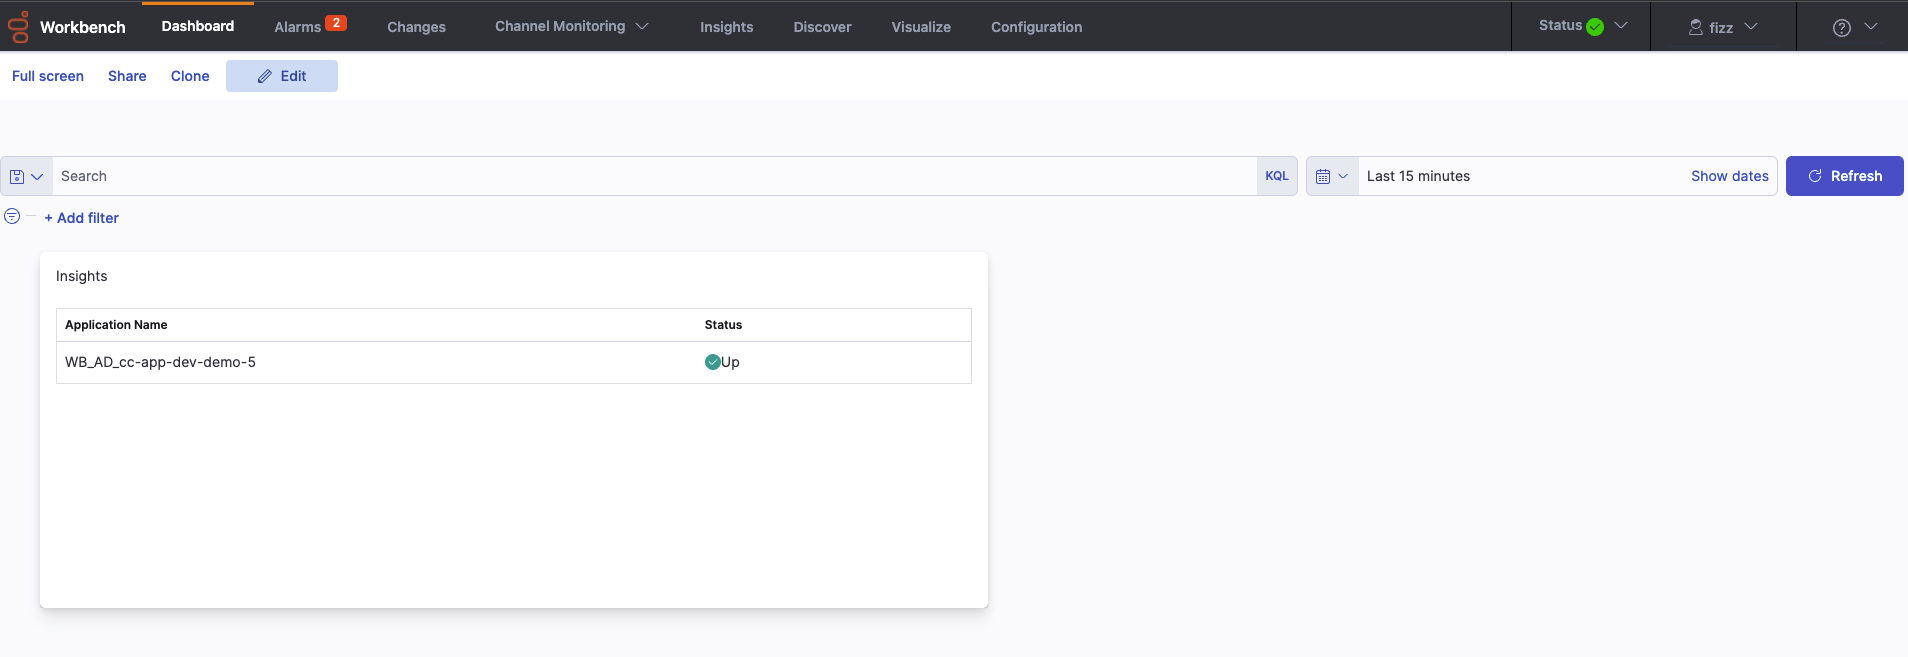
_Genesys_Insights_Status Example Dashboard
This example dashboard includes an AD Insights component Status Visualization to show the real-time status of the AD component(s).
Considerations
Important
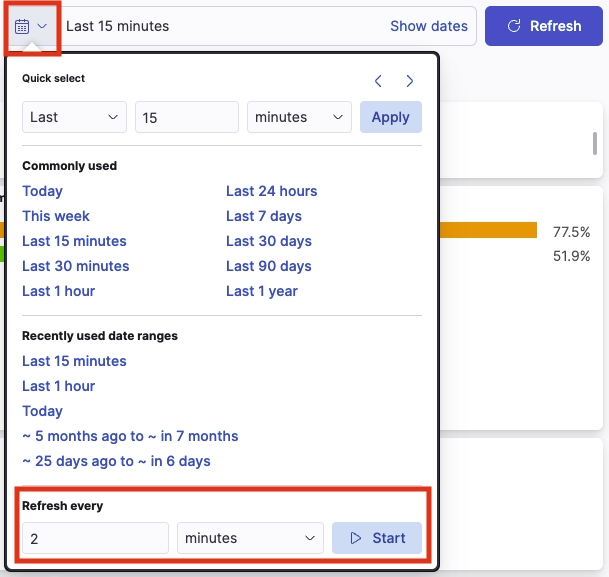
- From WB 9.3+ the Dashboards/Visualizations do not update by default in real-time
- Use the 'Quick Select' feature below to 'Start' auto Refresh functionality of Dashboards/Visualizations
Important
- For Workbench 9.2 to 9.3 upgrades, existing Dashboards/Visualizations will be migrated with a "_9.2" suffix
- The migrated "_9.2" Dashboards/Visualizations will not be functional given the changes from Kibana 7.1 to 7.17
- As such, when opening the migrated "_9.2" Dashboards/Visualizations, a Warning icon/message will be displayed
- Even though the migrated "_9.2" Dashboards/Visualizations are not functional and display a Warning, the logic for migrating is to provide context for previously created Dashboards/Visualizations
Important
- For detailed documentation about creating/customize your own Dashboards, please review the Dashboards section
This page was last edited on June 22, 2022, at 08:47.
Comments or questions about this documentation? Contact us for support!


