Dashboards
This section describes the Current and Historical Dashboards and how to use and configure the various widgets available on these dashboards.
Current Dashboard
The Current dashboard shows real-time information about Genesys applications and the servers where they’re running. It includes several data widgets:
- System Health dials show “at a glance” the aggregated current status of servers, applications, and services in your network. You can select several metrics to display including # Active Applications, # Agents Logged-in/Ready, # Simultaneous Calls, and # Active Critical Alarms.
- Component Health heat maps show the health of applications, hosts and solutions defined in your environment. For example, you can create a heat map to show all Application objects defined in the Configuration Server you specified during Workbench installation. You can also select a smaller group of applications for a custom view.
- Event Correlation Display shows real-time events occurring in your network during a one-hour rolling window. This display provides a single view of various data sources over the same timeline. The colored bars in each row indicate the number and severity of events for that data source at a given time. Data types include:
- Alarms in your Genesys environment
- Configuration Server changes occurring in your environment
- Log Events flagged for troubleshooting, if the Log File Management Tool is deployed
- Channel Monitoring errors and alerts detected by Workbench during test calls
Historical Dashboard
The Historical dashboard lets you access data that has rolled off of the Event Correlation Display on the Current tab, so you can analyze trends over longer periods of time. The Historical view shows you all the log events, alarms, and configuration changes for the month you select, to help you spot any long-term trends.
In addition to the Current and Historical dashboards, Workbench includes some specialized consoles that allow you to drill into details about the operation of your Genesys environment.
Widget Actions Menu
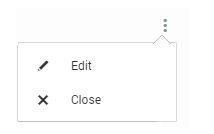
All Dashboard widgets have this actions menu in common, with one or both of these options:
Widget Actions Menu
- Edit allows you to configure adjustable portions of this widget.
- Close closes the current widget. (Note: Some core widgets cannot be closed)

