System Health
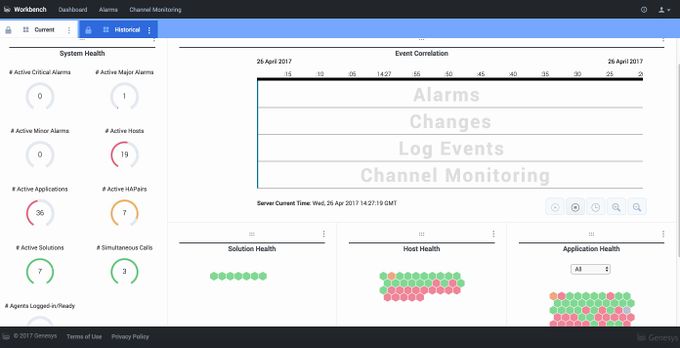
The System Health widget displays a configurable list of metrics that show the health of your environment at a glance.
The Dashboard initially shows all available metrics.
Workbench Dashboard in Current View
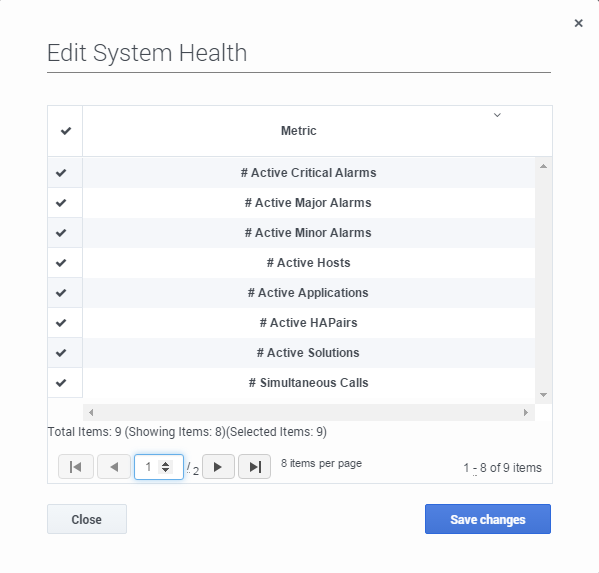
To configure the metrics shown in the select Edit from the actions menu. Then from the following configuration screen, select the metrics you want to be displayed in the System Health widget. Once completed, select Save Changes.
Edit System Health Widget Dialog
For several of the dials, the maximum value matches the total number of that object type that has been defined for your environment in Configuration Server. For example, the # Active Hosts dial has a maximum value of the total number of hosts defined in your Configuration Server. The maximum is derived in a similar way for the Applications, Solutions and HA Pairs system health dials. You can see the maximum value by hovering over the graphical part of the dial.
System Health Widget
The circle or border of each system health dial changes color based on the following calculations:
  For alarm-related dials:
  *Red if there is even one alarm
  *Gray if there are no alarms
  For the other dials:
  *Green if all objects represented in that dial are active
  *Yellow if 75-99% of the objects are active
  *Red if less than 75% of the objects are active


