Contents
Heat Map
The Heat Map widget allows you to select applications or hosts from a list of objects defined in your Configuration Server. The resulting heat map gives you a quick view of the overall health of that group of hosts or applications. You can create heat maps for three types of objects:
- Applications
- Hosts
- Solutions
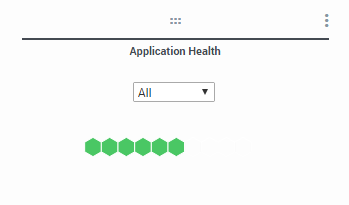
The color of each honeycomb in the resulting heat map indicates the status of that object.
Heap Map Honeycombs
The color scheme for Application, Host and Solution objects is as follows:
- If the object status is down : red color
- If the object status is unknown: grey color
- If the object status is up, then:
- if # Critical alarms > 0 then red color
- if # Major alarms > 0 then orange color
- if # Minor alarms > 0 then yellow color
- else green color
Create Heat Map
To create a heat map widget, select the Create Heat Map button on the upper left of the Dashboard Current tab.
Create Heat Map Button
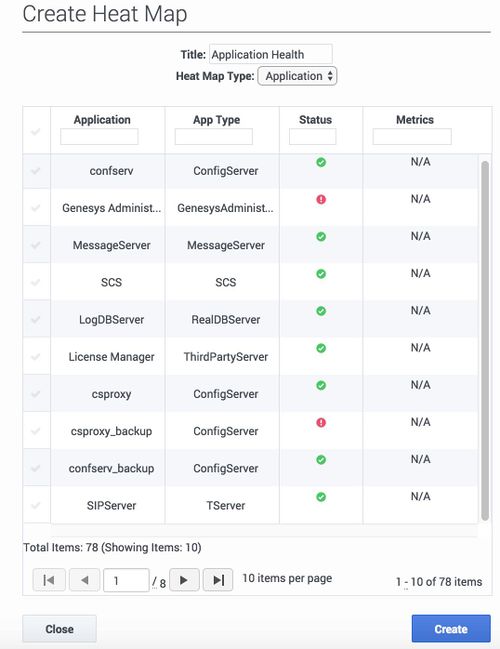
Create Application Heat Map Dialog
- Select the type of heat map you want to create: Application, Host or Solution. Depending on the type of heat map you select, three or four columns are displayed, showing:
- The list of objects for the type you selected. Hover on an object to see its full name.
- A status indicator for each object. Hover on the status indicator to see the current status of an object (up, down, or unknown).
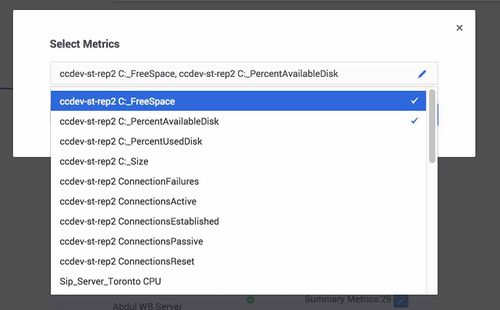
- The number of metrics available for each object, or N/A if none available. If metrics are available, click on the edit button to select the metrics you want to see in the hover text for objects in this heat map. All metrics are selected by default. De-select any metrics you do not want to see.
- For Application heat maps only, the type of application is also shown. Hover on an object to see the full text for the application type.
- Select the objects that will be included in this heat map.
- Edit the default text in the Title field to customize the heat map name.
- Click Create
- If you select more than 35 metrics, the detail bubble shown when you hover on a honeycomb in the heat map will not display the bottom rows of metrics.
- When a large number of metrics is selected, the Workbench footer becomes larger and the last rows of the honeycomb hover bubble are hidden under the footer. To correct this issue, hover on another honeycomb in the heat map.
- After Workbench Server initial installation, if you later change the value of the origin option in the general section of the Workbench Server application object in Configuration Server, metrics updates to heat maps will be disrupted, and all metrics data collected before the origin is changed will be lost. You will need to recreate all existing heat maps to restore metrics collection. For more information about setting the origin option, see Activating a Remote Alarm Monitoring License.
Create Solution Heat Map
You can create multiple heat maps. For example, one heat map could show all applications defined in your Configuration Server. A second could show a subset of your applications that you want to monitor together, possibly representing a particular data center or region. A third could show all the hosts in a given data center, etc. This flexibility allows you to create a topology of heat maps that is most useful for your deployment. In addition, you can select the metrics you would like to see in the hover using the Select Metrics dialog for each object
Select Metrics
Edit Heat Map
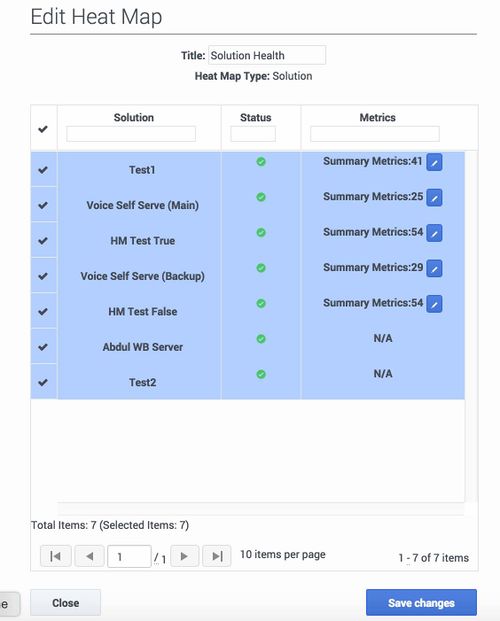
To edit a heat map, select Edit from the actions menu and adjust the list of objects by selecting or deselecting from the list. You can also adjust the heat map title. When you are done editing your selection, click Save changes.
Edit Heat Map Dialog
Heat Map Hover Info
When you hover over any honeycomb in a heat map, Workbench displays summary information about that object in the honeycomb detail bubble. Depending on the type of objects in the heat map and the current status of the object you hover on, some or all of these data points will be displayed:
- Solution name
- Host name
- Application name
- Site name
- Status of the object
- Alarms (grouped by critical, major, and minor)
- Applications on a host or in a solution
- Metrics available for the object, with their current values and units if applicable
Heat Map - Hovering Over a Cell
Heat Map Metrics Details
To open the Heat Map Metrics Details widget, double-click on any honeycomb object that has metrics. If you double-click an object with no metrics, the message "No metrics available" will be displayed in a hover pop-up. This may be because the Workbench Agent has not been installed on that application host. For an object with metrics, the Heat Map Metrics Details widget is displayed.
Once you set some properties, you can use this widget to graph one or two metrics associated with the object you double-clicked in the heat map.
For all object types, you need to set the time range to be displayed in the graph, or you can use the defaults:
- Start Time default: 24 hours before current date and time
- End Time default: Current date and time
If you double-clicked a Solution object, you need to select whether you want to see Application or Host metrics, and the specific application or host for which you want to see metrics. If you double-clicked an Application or Host object, these properties are auto-populated.
Heat Map Metrics Details – Solution Object – Select Graph Type
Heat Map Metrics Details – Solution Object – Select Specific Host or Application
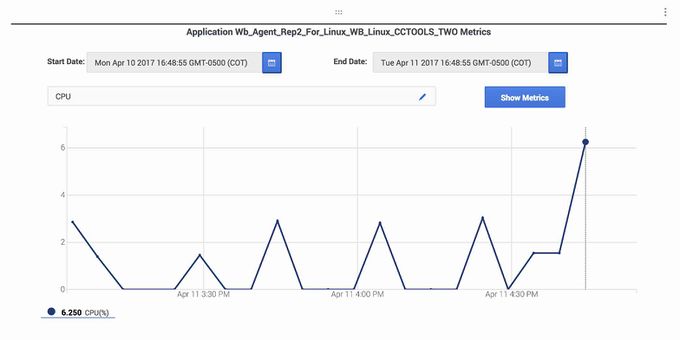
Next, select the one or two metrics you want to see in the graph, and click the Show Metric button.
Heat Map Metrics Details – Solution Object – Select Metrics

A graph of your selected metrics is displayed:
Heat Map Metrics Details – Solution Object – Two Metrics
If you selected two metrics, a graph like the one above is shown. You can click on either of the metrics at the bottom left of the graph to highlight the graph line for that metric. If you hover at any point on the highlighted line, Workbench displays the data points for both metrics at that intersection of the two graph lines.
If you selected one metric, the graph will look similar to the one shown below for an Application object.

