Debugging Toolbars
Contents
In GVP and ORS Debugging perspectives, the first pane contains Debug and Navigator views. The second pane contains views for Variables, Breakpoints, and Expressions. A GVP example is shown below.
Debug View
The Debug view shows the name of the callflow or workflow diagram being debugged, as well as the status of the debug progress or result.
Each toolbar button is identified in the table below.
| Remove All Terminated Launches
Select to clear the Debug view of all terminated launches. | |
| Resume
Select to resume the execution of the currently suspended debug target. | |
| Suspend
[Not supported in Composer] | |
| Terminate
Select to terminate the launch associated with the selected debug target. Once a launch is terminated it can be automatically removed from the Debug view. When using the ORS Debugger, Terminate means that the session in ORS will end along with the debugging session. | |
| Disconnect
Not supported for the GVP Debugger. When using the ORS Debugger, Disconnect means that the debugging session ends, but ORS will continue executing the SCXML. | |
| Step Into
Disabled for both routing and voice applications. | |
| Step Over
Step Over is the only way to step for both routing and voice applications. Select to step over the next method call (without entering it) at the currently executing line of code. Even though the method is never stepped into, the method will be executed normally. | |
| Step Return
[Not supported in Composer] | |
| Drop to Frame
[Not supported in Composer] | |
| Use Step Filters
[Not supported in Composer] | |
| View Menu
Select from the following:
|
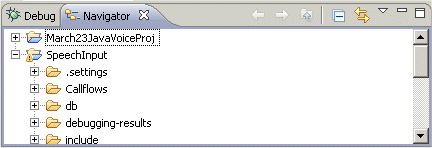
The Navigator view shows the same Project folder structure shown in the Project Explorer window of the Composer perspective.
Each toolbar button on the Navigator toolbar is identified in the table below.
| Back
Moves back. | |
| Forward
Moves forward. | |
| Up
Navigate up one level in the hierarchy | |
| Collapse All
Select to collapse all of the current elements in the view. | |
| Link Open Editors
When you have multiple files open for editing, select to bring an open file to the foreground (make its editor session the active editor) every time you select that open file in one of the navigation views. | |
| View Menu
Select to show additional actions for this view.
|
Variables View
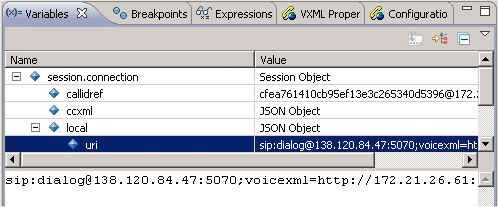
The Variables view displays information about the variables associated with the stack frame selected in the Debug view. When debugging a Java program, variables can be selected to have more detailed information as displayed below. In addition, Java objects can be expanded to show the fields that a variable contains.
Each toolbar button in the Variables view is identified in the table below.
| Show Type Names
Select to change if type names should be shown in the view or not. Unavailable when columns are displayed. Hint: Select Layout from View menu and de-select Show Columns. | |
| Show Logical Structure
Select to change if logical structures should be shown in the view or not. | |
| Collapse All
Select to collapse all the currently expanded variables. | |
| View Menu
Select from the following:
|
Breakpoints View
The Breakpoints view and toolbar manage breakpoints within a debugging session.
Each toolbar button in the Breakpoints view is identified in the table below.
| Remove Selected Breakpoints
Select to clear all selected breakpoints. | |
| Remove All Breakpoints
Select to clear all breakpoints. | |
| Show Breakpoints Supported by Selected Targets
Select to show all breakpoints supported by the selected targets. | |
| Go To File For Breakpoint
[Not supported in Composer] | |
| Skip All Breakpoints
Select to skip over all breakpoints. | |
| Create URL Breakpoint
Select to create a breakpoint that uses a URL. | |
| Expand All
Select to expand all the current breakpoints. | |
| Collapse All
Select to collapse all the current breakpoints. | |
| Link With Debug View
[Not supported in Composer] | |
| Add Java Exception Breakpoint
Select to open a dialog box where you can:
[This option is not relevant to GVP Debugging in Composer.] | |
| View Menu
Select from the following:
|
Expressions View
Use the Expressions view to inspect data from a stack frame of a suspended thread, and other places.
Each toolbar button in the Expressions view is identified in the table below.
| Show Type Names
Select to change if type names should be shown in the view or not. Unavailable when columns are displayed. Hint: Select Layout from View menu and de-select Show Columns. | |
| Show Logical Structure
Select to change if logical structures should be shown in the view or not. | |
| Collapse All
Select to collapse all the currently expanded expressions. | |
| Create a New Watch Expression
Select to open the Create New Expression dialog box, which allows you to create a new watch expression based on the selected variable and add it to the Expressions View. | |
| Remove Selected Expressions
Select to remove the selected expressions. | |
| Remove All Expressions
Select to remove all expressions. | |
| View Menu
Select from the following:
|


