Debugging Voice Applications
Contents
- 1 Debugging Voice Applications
- 1.1 Video Tutorial
- 1.2 GVP Debugger
- 1.3 Run Versus Debug
- 1.4 Starting a Debugging Session
- 1.5 Debugging When Using Context Services
- 1.6 GVP Debugging Perspective
- 1.7 Debugging Tools
- 1.8 Debugging Views
- 1.9 Debugging a Callflow
- 1.10 Creating a Debug Launch Configuration
- 1.11 Debugging-results Folder
- 1.12 Code Generation of Multiple Callflows
- 1.13 Debugging VoiceXML Files
- 1.14 Creating a Run Launch Configuration
- 1.15 Adding Breakpoints
- 1.16 Debugging Server-Side Pages
- 1.17 Debugging TLS Support
- 1.18 Limitations
Video Tutorial
Below is a video tutorial on debugging VoiceXML applications.
Important Note: While the interface for Composer in this video is from release 8.0.1,
the steps are the basically the same for subsequent releases.
GVP Debugger
Composer's GVP Debugger provides real-time debugging capabilities for Genesys Voice Portal voice applications. The debugger is integrated with GVP for making test calls, viewing call traces, and debugging applications. It supports accessing SOAP and REST based Web Services. Database access is provided using server-side logic and a Web services interface. Prior to debugging, set preferences for the GVP Debugger, which supports both Run and Debug modes.
Run Versus Debug
- In the Run mode using Run > Run Configuration, call traces are provided and the application continues without any breakpoints.
- In the Debug mode, using Debug as > Debug Configuration, you can input breakpoints, single-step through the code, inspect variable and property values, and execute any ECMAScript from the query console.
Integration with a SIP Phone is provided with a click-to dial feature for making the test calls. You can debug:
- A callflow built with Composer, or
- Any VoiceXML application or set of VoiceXML pages whether or not they were created with Composer.
Notes:
- Previous to GVP 8.1.4, one instance of GVP's Media Control Platform (MCP) supported only one Composer debugging session. This limitation no longer exists in GVP 8.1.4.
- Debugging is supported only on Tomcat. VXML debugging is the same on any application server so debugging using Tomcat is sufficient.
- Composer 8.1 uses TCP to send SIP messages (previous releases used UDP). This is not a configurable option.
Starting a Debugging Session
If using Context Services:
- Set Context Services parameters: Window > Preferences > Composer > Context Services. In Context Services Preferences, specify the Universal Contact Server host and port.
You can start a debugging session in the following ways:
- Right-click on the diagram/VXML file. Select Run As > Run Callflow or Debug As > Debug Callflow.
- On the main toolbar, there is a Debug
 button and a Run
  button. Clicking relaunches the most recently used configuration. You can also use the keyboard shortcuts Ctrl+F11 (for Run) and F11 (for Debug).
 - If you click the down arrow on these buttons to drop down a menu, a history of recent launches appears.
All of the above is also available in the Run top-level menu.
Debugging When Using Context Services
If using Context Services, you must do the following before debugging a callflow or a VXML application:
- Check the Connect to the Universal Contact Server when designing diagrams preference option in the Context Services preference page.
- Set the UCS parameters Context Services preference page.
Composer then automatically appends an extra context_services_url parameter to the SIP URI. This parameter is then read by the GVP application at runtime, enabling the GVP application to connect to the UCS.
GVP Debugging Perspective
The figure below shows Composer's elements for the GVP Debugging perspective (callflow debugging):
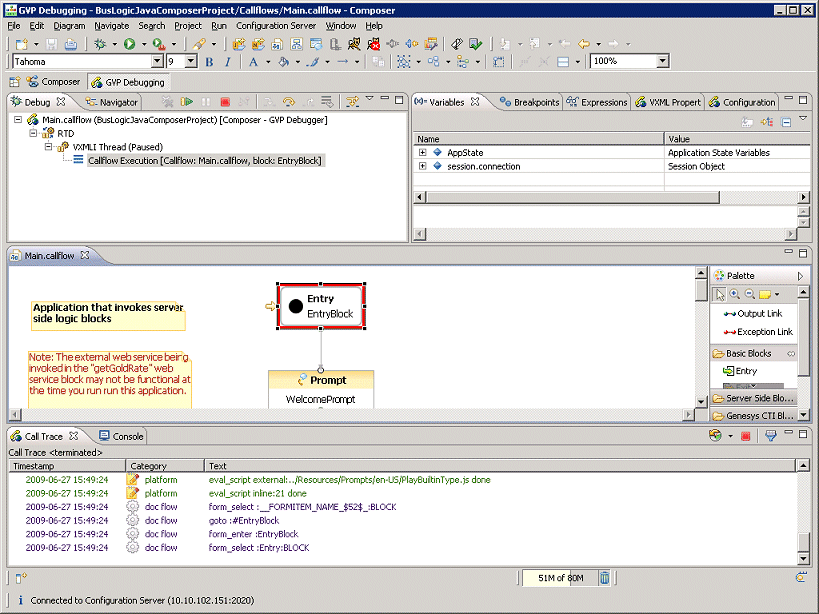
- The Debug view shows the callflow diagram name being debugged, as well as the status of the debug progress or result.
- The Navigator view shows the same Project folder structure shown in the Project Explorer window of the Composer perspective.
- The callflow diagram is displayed below if you are debugging a callflow. At the beginning of the debug session, a red box surrounds the Entry block of the callflow to indicate the start point. The focus changes as the session progresses, and a red box displays wherever the call execution suspends, regardless of whether or not there’s a breakpoint.
- The Call Trace view displays metrics which describe the events occurring in the application, such as recognition events, audio playback, user input, errors and warnings, and application output. The history functionality of the call trace view shows the call traces from past calls.
- The Console is for executing ECMAScript commands on the interpreter.
Debugging Tools
See the Debugging Toolbars topic.
Debugging Views
The upper right of GVP Debugging Perspective contains the following views:
- Variables allows you to monitor the state and value of any variable used in the application, to see how the variable changes during execution. This shows all global variables of the application, and also the recognition results of the previous recognition, if any.
- Breakpoints allows you to select a position in the VoiceXML application to suspend execution instead of stepping through the application one command at a time.
- Expressions indicates watch expressions you can add and monitor during execution. You can change the value of these expressions to see how they impact the application.
Note: The VXML Properties and Configuration views are for information only; they do not perform any tasks.
- VXML Properties are the properties defined in the VXML application by <property> tags. This includes application-specific properties (set in the Entry block) as well as default properties defined by the platform.
- Configuration parameters are the configuration items of the VXMLI. Basically it is what you would see in the vxmli section of the MCP settings in MF.
Debugging a Callflow
The GVP Debugger allows you to debug a callflow by single-stepping through the blocks. Prior to debugging, you should have validated the callflow, generated the code, and deployed the project for testing. Also, if you have not already done so, set GVP Debugger preferences. Select Window > Preferences > Composer > Debugging > GVP Debugger and configure the GVP Debugger.
Creating a Debug Launch Configuration
To test your callflow by stepping through it, use Debug Configurations to first create a launch configuration: To run your callflow for debugging use Debug Configurations:
- In the Project Explorer, expand the Composer Project and its callflows subfolder.
- Right-click on the callflow filename in the Project Explorer and select Debug as > Debug Configurations.
- Expand Composer - GVP Debugger.
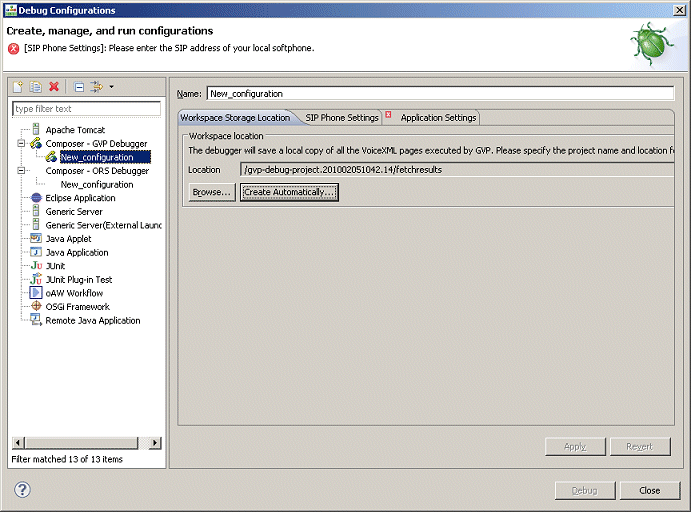
- Select New Configuration. The Debug Configurations dialog box opens. An example is shown below.
- Name the configuration.
- Click the Create Automatically button to create a new project folder to save the metric traces and VXML pages as the calls are being executed. This folder appears in the Location field as shown above.
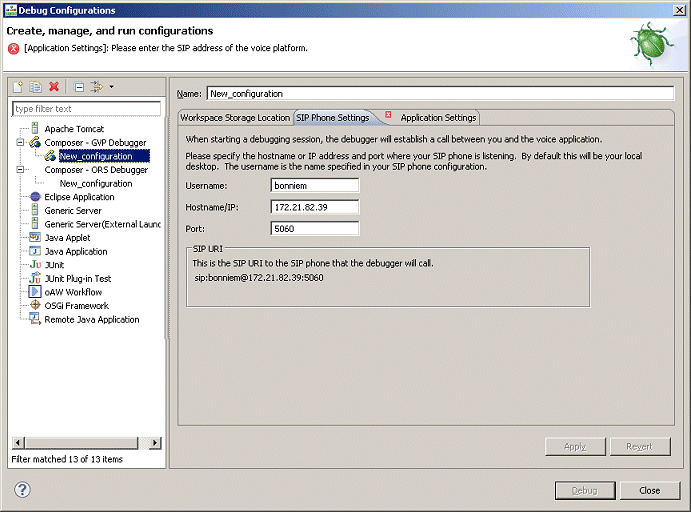
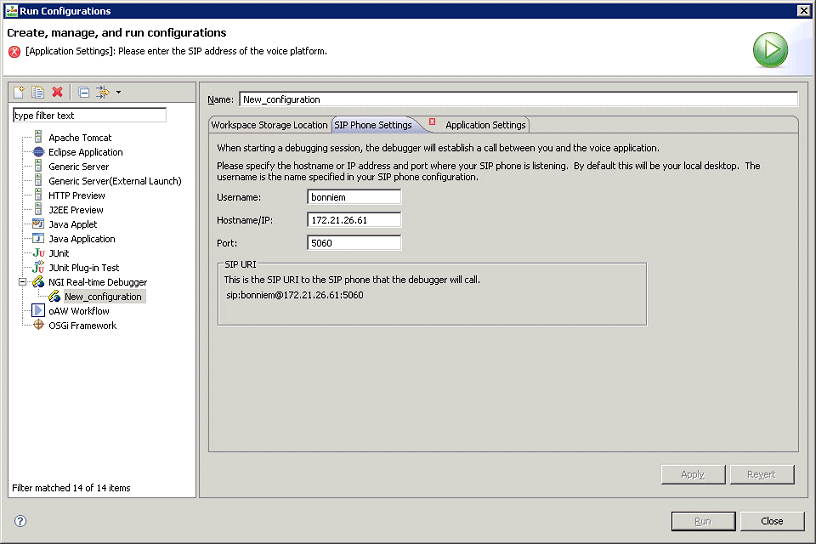
- Click the SIP Phone Settings tab and provide your SIP Phone information if not already there from GVP Debugger Preferences. An example is shown below:
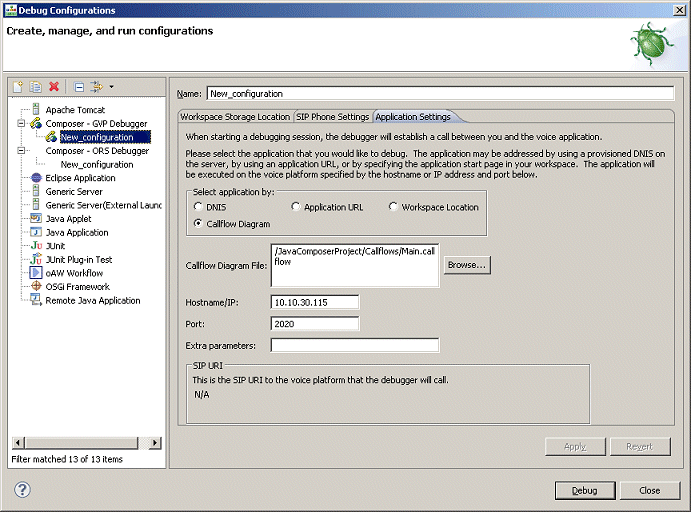
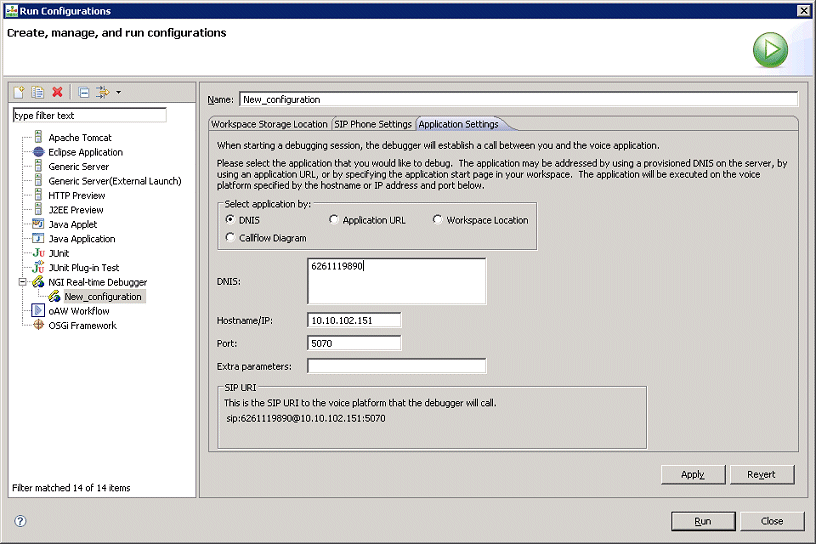
- Click the Application Settings tab and select Callflow Diagram. An example is shown below:
- You can pass CTI Input variables in a Debugger call. Input variables in a callflow diagram can be initialized in a Debugger call using the Extra Parameters field in the Run / Debug Configurations > Application Settings tab. The Parameter names should match the "Input" variable defined in the Entry Block of the Callflow diagram.
- Click Apply.
- Click Debug. This will automatically dial out your SIP Phone.
- Accept the call and you will be connected to the application on GVP. Composer switches to the GVP Debugging perspective.
Once the call is initiated you will see a red box around the first block of the application. This indicates the current location where the call is paused. Note: The GVP Debugger skips over deactivated blocks.
- Click the Step Over
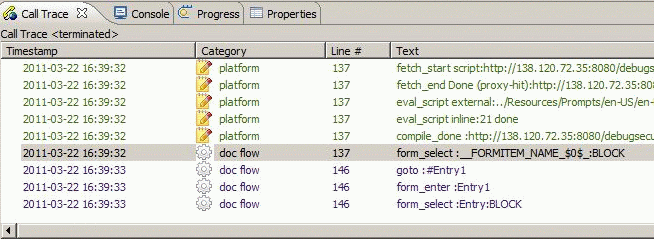
 button to single step through the blocks. Note: Step Over on the Debugging Toolbar is the only way to step for both routing and voice applications. Blocks in the diagram correspond to <form> elements in the generated VXML. When stepping through a callflow diagram, the debugger is stepping through <form> elements in the underlying VXML. The call traces will become visible in the Call Trace view at the bottom. An example is shown below.
 Application state and last user input values can be seen in the Variables tab.
- You can input breakpoints from the context menu on a block and select Toggle Breakpoint . When breakpoints are set, you can press F5 to resume the call to the next breakpoint, instead of single stepping block-by-block.
- You can change values of variables in the middle of the callflow. This could be used to quickly change the execution path as the call is progressing. Right-click in the Expressions tab and select Add Watch Expression. In the Add Watch Expression window, add a new expression to watch during debugging. For example, give the name as AppState.<actual variable name>.
- To change the value, expand the variable, right-click on the child item and select Change value. A popup window as shown above will open, and you can specify the new value. Click OK. Proceed with debugging of the application and see the changed value.The value of the watch expression can be refreshed at any time by right-clicking on it and selecting Reevaluate Watch Expression.
Debugging-results Folder
The GVP debugger creates a debugging-results folder in the Project Explorer. There is currently no automatic cleanup so the number of files can become large. Clean up the debugging results by deleting the gvp-debug.<timestamp> folders from the Project Explorer. Each gvp-debug.<timestamp> folder corresponds to a single debug call that was made at the time specified by the timestamp. It contains files downloaded by the debugger. The metrics.log file contains the Call Trace of the call.
Code Generation of Multiple Callflows
When using the Run Callflow or Debug Callflow functions, Composer automatically generates the VXML files from the diagram file that you want to run. In the case of a Java Composer Project that has multiple callflows, Composer attempts to generate the VXML for all the callflows before running (because the application might move between multiple callflows for subdialogs). However, if one of the callflows has an error, Composer provides the option to continue running the application anyway, because the erroneous callflow may be a callflow that’s not used by the one being run (if there are two or more main callflows, for example). When this happens, the VXML files are basically out of sync with the diagram files and this may affect execution. Genesys recommends that you fix all errors before running the application.
Debugging VoiceXML Files
- VXML debugging does not work on 64-bit operating systems when Transport Layer Security if TLS is enabled in Context Services Preferences. If TLS is not enabled, debugging works as expected.
- Debugging is supported only on Tomcat. VXML debugging is the same on any application server so debugging using Tomcat is sufficient.
- When subdialog calls external VXML page in debug mode, Composer throws the following error: An internal error occurred during: Debug Source Lookup. This is a known limitation. The problem occurs when stepping through a callflow with a subdialog block that links to a VXML page. A "mode switch" between debugging a callflow diagram and debugging a VXML page is not supported. Workaround is to start debugging the generated code instead as a VXML page, which will step into the hand written VXML page when it is called.
- VoiceXML applications can be tested using the real-time GVP Debugger. Support for both Run and Debug mode is provided.
- In the Run mode, the call traces are provided and the application continues without any breakpoints.
- In the Debug mode, you can input breakpoints, single-step through the VoiceXML code, inspect variable and property values, and execute any ECMAScript from the query console. Integration with a SIP Phone is provided and click to dial feature is provided for making the test calls.
- Tomcat engine is bundled as part of Composer and the application is auto deployed and auto-configured for testing. Programmers can test by specifying the DNIS of the application already provisioned in MF or provide the URL of the application or let Composer auto-configure the application for testing.
There are various ways to start a debug session. The next section describes Run Mode and Run Launch Configurations.
Creating a Run Launch Configuration
In order to test and debug applications configured in the Genesys Administrator Console as an IVR Profile, you will have to create a launch configuration for making test calls.
- From the Run menu select Run Configurations.
- In the dialog box, right-select NGI Real Time Debugger and select New from the menu.
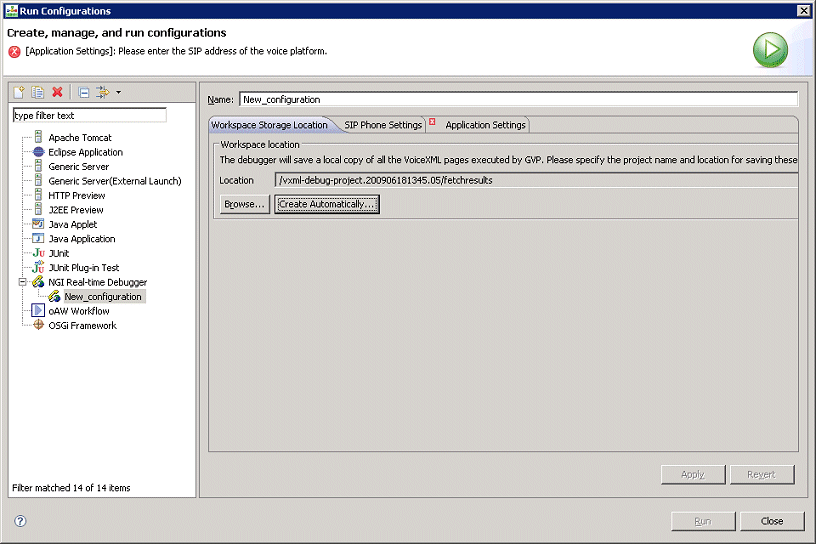
- Define the launch configuration. The figure below shows an example completed Workspace Storage Configuration tab.
- Click the Create Automatically button to create a new Project folder to save the metric traces and VXML pages as the calls are being executed. This folder appears in the Location field as shown above.
- Click the SIP Phone Settings tab and provide your SIP Phone information if not already there. An example is shown below:
- Click the Application Settings tab and select the DNIS option. Specify the DNIS of your application and the IP Address of your GVP (MCP / RM), as well as the port. An example is shown below:
- The Application URL option is for an application that is not provisioned, but is hosted at an HTTP URL.
- The Workspace Location and Callflow Diagram options are generally not used to create launch configurations. Those launch configurations are automatically created using Run As Callflow or Run As VXML file.
- You can pass CTI Input variables in a Debugger call. Input variables in a callflow diagram can be initialized in a Debugger call using the Extra Parameters field in the Run / Debug Configurations > Application Settings tab. The Parameter names should match the "Input" variable defined in the Entry Block of the Callflow diagram.
- Click the Apply button and then click Run.
- Your SIP Phone should get dialed. Accept the call in your SIP Phone and then the Debugger will dial out to GVP and connect the call.
- You should then see call traces in the Call Trace view.
Adding Breakpoints
To toggle breakpoints, double-click the side area of the Editor window as shown in the figure below:

Debugging Server-Side Pages
This section covers server-side debugging with the TCP/IP monitor. Composer includes a TCP/IP monitor which can be used to debug server-side code such as Server Side blocks and Database blocks. To monitor TCP traffic on the Tomcat or IIS port, follow these steps:
- Check the Composer Preferences page to determine the port on which your bundled Tomcat is running. If you are using IIS, see the IIS port configured for Composer in Preferences.
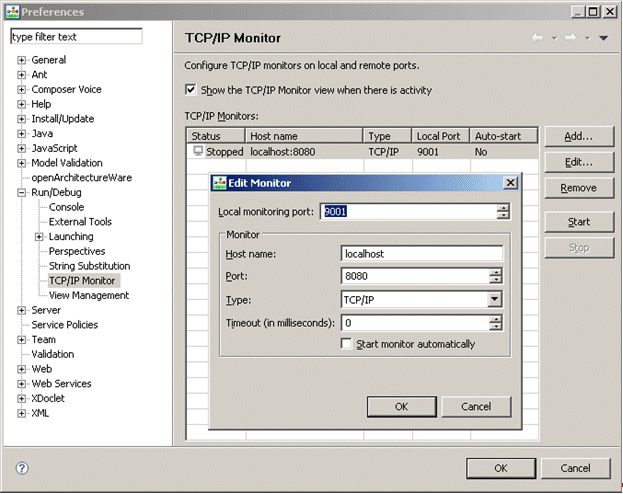
- Enable the TCP/IP monitor in Preferences (Window > Preferences, expand Run/Debug and select TCP/IP Monitor. Select the Show the TCP/IP Monitor view when there is activity check box.
- Add a new monitor entry in TCP/IP monitor preferences. The Monitor section refers to the target being monitored. Use the configured port in the previous step as the port to monitor. For example, use 8080 and start the monitor.
- Update your Tomcat port / IIS port to the Local Monitoring Port.
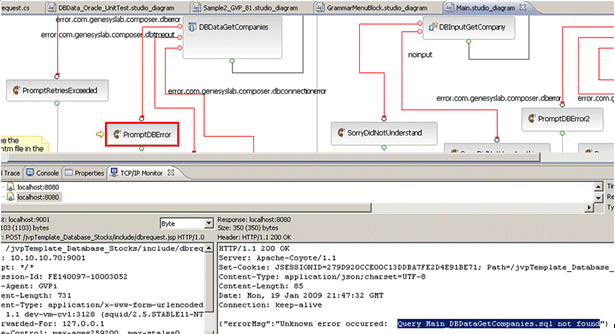
- Start debugging your application and put breakpoints on appropriate blocks. The debug perspective will start showing the TCP/IP Monitor view. If the view is not visible, access it from Window > Show View. The image below shows the bundled Database Stock Application being debugged. The TCP/IP Monitor view shows the error returned by server-side pages that handle database interactions.
 For additional information, see the following sections in the Eclipse Workbench User Guide Help available from within Composer (Help > Help Contents):
- TCP/IP Monitor view
- Defining TCP/IP Monitor preference
- Using the TCP/IP monitor to test web services
Debugging TLS Support
The instructions below describe how to (optionally):
- Configure a secure connection (Use Secure Connection) to GVP's Media Control Platform (MCP) during voice application debugging when using SIPS.
- Use a Transport Layer Security (TLS) connection for the Debugger control channel.
For additional information, see the Genesys 8.1 Security Deployment Guide. Note: MCP version 8.1.401.07 or later is required to use the TLS feature for debugging. 1. Import the certificate for MCP as follows:
- In the MCP’s configuration, in section vxmli, there is a debug.server.tlscert parameter. (By default, this is $InstallationRoot$/config/x509_certificate.pem.) Copy this file from the MCP installation to a location on Composer’s local machine.
- In Composer, go to Window > Preferences. Select Composer > Security in the tree. Click Import Certificate and navigate to the x509_certificate.pem file.
- Restart Composer.
2. Enable debugging from MCP configuration as follows:
- Set [vxmli]:debug.enabled to true.
- Ensure that [vxmli]:debug.server.tlsport and [vxmli]:debugserver.tlsport.public are set. (By default, it is set to port 27668.)
- In Composer, go to Window > Preferences and select Composer > Debugging > GVP Debugger. Check Use Secure Connection to enable security. The Platform Port setting should match the MCP configuration [sip]:transport.2.
Limitations
The GVP Debugger has the following limitations:
- CTI calls are not supported.
- Transfers of type blind and consultation do not work when a test call is made using the GVP debugger. The call will reach the Transfer block, but then it will hang and not proceed so you will need to terminate the call or debugging session manually.
A partial workaround is to set the Transfer Method property to bridge (i.e.. Transfer Type = blind/consultation, Method = bridge) before debugging. The transfer will proceed, but the debugging session and the call will terminate immediately afterwards. Genesys recommends that you do full testing for Transfer applications by provisioning the application in Genesys Administrator and making test calls directly from the SIP phone. These limitations apply to Run Callflow (in Run mode) as well.


