
Genesys CX Insights
Genesys Customer Experience Insights (Genesys CX Insights or sometimes GCXI) provides a presentation layer that extracts data from the Genesys Info Mart database, and presents it in readable historical reports to enable business and contact center managers to make better business decisions for streamlining operations, reducing costs, and providing better services.
Genesys CX Insights has replaced Genesys Interactive Insights (GI2) as the historical reporting presentation layer. See also Genesys Info Mart and Reporting and Analytics Aggregates (RAA).
Glossary
Contents
- 1 Understanding and using reports
- 1.1 Reports
- 1.2 Dashboards
- 1.3 CX Insights interfaces
- 1.4 Video: Generate reports in Genesys CX Insights
- 1.5 Accessing and running reports and dashboards
- 1.6 Help finding reports
- 1.7 Anatomy of a report
- 1.8 The report grid
- 1.9 Video: Drill or filter in reports
- 1.10 Controlling what data appears in a report
- 1.11 Filtering report data
- 1.12 Drilling in report data
- 1.13 Printing or exporting report data
- 1.14 Scheduling the delivery of reports
- 1.15 Enabling Languages on the server
- 1.16 Changing the language used in the reports
- 1.17 Video: Change the language used in reports
- 1.18 Where can I learn more?
Understanding and using reports
This page helps you understand Genesys Customer Experience Insights (Genesys CX Insights) reports and dashboards. The Genesys CX Insights reports and dashboards for Genesys Info Mart compile historical contact center interaction activity and agent-summarized states for telephony and multimedia DNs.
Reports

Genesys CX Insights includes several dozen reports out-of-the-box, which are available in subfolders within the CX Insights folder. The data in the reports represents a snapshot of the database at a given point in time; to view current data, you must run the report to display the latest data. The reports use the hierarchies, metrics, attributes, prompts, details, and filters that are defined in the CX Insights Project.
Reports are designed using MicroStrategy Web. The figure shown here illustrates the organization of some of the reports in the Agents folder and some of the operations that you can perform within MicroStrategy Web. For more information about customizing the reports, see Customizing reports and dashboards
Dashboards

Genesys CX Insights includes several dashboards out-of-the-box. While some dashboards are available in the CX Insights > Dashboards folder, many are found in other folders, where they are grouped with reports based on the type of content they provide -- see the latest list of Dashboards for more information.
The Genesys CX Insights dashboards provide visual summaries of information that would otherwise be displayed across several reports. The data in the dashboards represents a snapshot of the database at a given point in time; to view current data, you must run refresh the dashboard to display the latest data. For optimal viewing of the dashboards, set your screen resolution to a the highest resolution that is practical, and in any case, to a width of at least 1280 pixels.
Dashboards are designed using MicroStrategy Web. For more information about customizing the dashboards, see Customizing reports and dashboards
CX Insights interfaces
Your interaction with CX Insights will usually take place in one of two GUIs:
- MicroStrategy Web — When you view, run on-demand, or modify a report or dashboard, you do so using MicroStrategy Web, the primary Genesys CX Insights GUI, which you access using the URL (<yourserver>/MicroStrategy/servlet/mstrWeb) provided by your administrator. Administrators can configure permissions that determine which operations each user can perform in MicroStrategy Web. MicroStrategy Web is discussed on this page.
- MicroStrategy certifies the latest versions, at the time of release, for the following web browsers:
- Apple Safari
- Google Chrome (Windows and iOS)
- Microsoft Edge
- Microsoft Internet Explorer (Versions 9 and 10 are supported, but are not certified)
- Mozilla Firefox
- MicroStrategy Developer — Reserved for administrator use, MicroStrategy Developer is a standalone application you access on the computer where MicroStrategy software is deployed. Use Developer to create and manage projects, objects and users, and to perform other administrative actions. MicroStrategy Developer is discussed in more detail on the Understanding the Project page.

Mobile support
You can also access Genesys CX Insights dashboards from your Apple iPad. Genesys supports accessing the dashboards in this fashion, but does not recommend using reports from a mobile device, as they are not designed for small screens. See the Genesys CX Insights Deployment Guide for more information, and the MicroStrategy website.
Genesys documentation, including this document, also supports mobile devices. In most cases, it easier to use Genesys CX Insights, and the documentation, in landscape mode.
Video: Generate reports in Genesys CX Insights
This video describes how to generate reports in Genesys CX Insights.
Accessing and running reports and dashboards

- Go to the Genesys CX Insights (MicroStrategy Web) link provided by your administrator.
- If a page appears where you can select a server, choose the server on which to view reports (you probably have only one, but if more than one appears, and you are not sure which one to select, contact your administrator).
- If prompted, enter your user name and password.
- The Genesys CX Insights page appears. Click Shared Reports > CX Insights.
In most cases, the reports you need are found in the Shared Reports folder:- Shared Reports—Reports and dashboards stored in the Shared Reports are available to other users (access privileges permitting).
- My Reports—Reports stored in your private folders, such as My Reports, are visible only to you. This folder is visible only to users who have sufficient privileges to edit or save reports.
- Reports are divided into subfolders based on function; select a sub-folder, for example Business Results.
- From the listed reports, either double-click a report, or right-click and choose Run. For example, Business Metrics Executive Report. The prompts for that report appear.
- Select a date or date range, and optionally make selections for other prompts.
To generate meaningful reports, choose dates for which your environment has data. Note that, if you are working in a demo/development environment, data is available for a limited period:- For Genesys CX Insights reports, data is available for the period September 2015 to October 2016.
- For Genesys CX Insights for iWD reports, data is available for the period February 12, 2019 to February 21, 2019.
[+] More about prompts - Click Run Report.
The report appears. You can filter, drill, and otherwise interact with many report values.
Shared Reports > CX Insights > Business ResultsClick any word in the breadcrumb to return to that folder.
Help finding reports

You can use the search feature to easily find all reports with a given word or phrase in the report name:
- Select the top level CX Insights folder (to search the entire folder).
- At the top of the page, click the magnifying glass to open the search window.
- Select a folder (for example Shared Reports) in which to search, enter a search term (for example Callback), and press Enter (or click the magnifying glass).
- For more powerful search options, click Refine. Advanced search options appear, which you can use to refine your search based on various criteria, such as object type, owner, date, or description.
Anatomy of a report

Each report is divided into several sections (except for the main section of the report, each section is called an 'editor'):
- Report Details Editor — provides information about the data in the report. You can optionally close this editor by clicking x.
- Prompt Details Editor — provides information about the prompt values used to run the report. You can optionally close this editor by clicking x.
- The report grid — In most cases, reports consist of a simple grid, illustrating the selected data. Some prompt and metric names shown in reports are self-explanatory, but some may require explanation; see the individual report descriptions (see the list of reports) for more information about specific prompts and metrics.
- Other editors appear if you open them, such as the View Filter Editor.
What zero signifies in a report
Whenever the underlying query for a Genesys CX Insights report returns no rows, the report displays no data. For example, a query to retrieve activity for a particular agent for a shift that the agent did not work returns no data.

For those Genesys CX Insights reports that do return rows, but in which a particular field is not applicable, the reports return a value of 0.
For example, this occurs when all interactions for a particular day are accepted within the first four service time intervals that are defined for a tenant, but none are accepted beyond the fourth interval. As a result, the Speed of Accept (seconds) Report—a portion of which is shown in the figure Zero Values in the Speed of Accept Report—displays 0 values for the each of the fifth through tenth intervals.
The reports also return 0 for measures when the underlying database columns on which measures are based hold 0 values. Additionally, when a report is based on a query that gathers data from more than one aggregation table, empty cells in reports are possible where other cells contain data.
For composite measures, such as percentages and averages, wherever a 0 count or 0 duration ensues, the reports display 0 for such measures. The average duration of calls placed on hold, for instance, is 0 in the circumstances where either no calls were placed on hold during the interval, or where the duration of held calls was 0 seconds (or a fraction of 1 second).
The custom reports that you create might behave differently depending on their design.
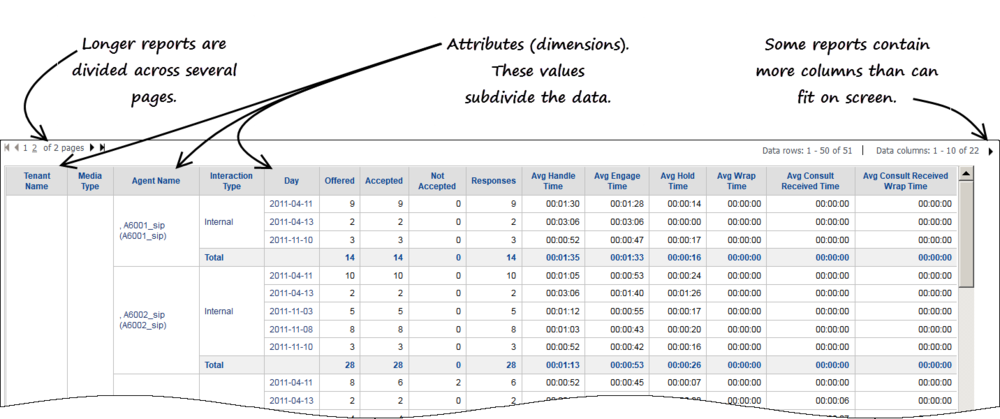
The report grid
The main area of a typical report consists of a simple grid, optimized for on-screen viewing, but also easily printed to PDF, XLS or other formats. (For reports with a lot of columns or rows, you may find it easiest to view your reports as PDFs.)
The first few columns of each report represent Attributes (also known as Dimensions). These are values that divide up the data, and their impact is cumulative, from left-to-right. For example, in the Agent Utilization Report (shown here), the first column divides the data by Tenant Name, the second column subdivides the tenant data by Media Type, the third column subdivides the tenant/media data by Agent Name, the fourth column subdivides the individual agent data by Interaction Type, and the fifth further breaks that down by Day.
Depending on your access role and the report you are viewing, you can manipulate a report in several ways:
- Sort—Right-click in a column, and choose an option from the Sort menu, to sort the table by the order of that column. Or, choose Sort Grid to sort the table by more than one column. Not all columns can be sorted.
- Drill—Right-click in a column, and choose an option from the Drill menu, to drill up or down on the data in that column. For example, to change from viewing data for the Month, to viewing it for the Day, Hour, or even the Year. See Drilling in report data. Not all columns can be drilled.
- Filter—Right-click in a column, and choose an option from the Filter on menu, to open the View Filter Editor, where you can select one or more conditions. See Filtering report data.
Agent-based reports do not contain data that summarizes virtual interactions, virtual agent activity, and Interactive Voice Response (IVR) port activity. However, if IVRs are configured as handling resources in your environment, data that pertains to IVR ports is included in the business attribute and interaction detail reports.
Video: Drill or filter in reports
This video describes how to read, drill, and filter historical reports in Genesys CX Insights.
Controlling what data appears in a report

In many cases, you may want to restrict what data is gathered into a report; for example:
- if your environment contains a large amount of data, some reports can become very long.
- if you want to see a report about just one aspect of the contact center, such as single agent group.
When you open any report, the report prompts appear, where you can customize the data that is taken into the report. The prompts available are specific to each report—the example shown here pertains to the Agent Conduct Report:
- For each prompt, enter or select appropriate values. Each prompt provides either a drop-down list or a search field and accompanying button.
- Use the Index, to the left of the prompts input area, to quickly jump to any section of the prompts.
[+] Show: Prompts in the Agent Conduct Report
Filtering report data

After running a report, you can further filter the data that appears in the report. These filtering options are powerful, and let you make more selections than those you made on the prompts page when you ran the report. You can add more than one filter on a report.
Use either of the following to methods to filter a report:
Creating a filter using the View Filter Editor
Open the View Filter Editor to manually construct a filter.
- Open and run a report. For example, Agents > Agent Utilization Report.
- Click Tools > View Filter.
The View Filter Editor appears. - Click Add Condition.
The Filter On drop down list appears. - Click Filter On, and select a value on which to filter. For example, Agent Name will allow you to show only specified agent in the report.
A list of Available agent data appears. - Double-click the name of each Agent to include (you can include one, several, or even all), and click Apply.
You can add more than one filter on a report.
Filtering on selections
Use Filter On to build a filter more quickly.
- Open and run a report. For example, Agents > Agent Utilization Report.
- Right-click a value that you'd like to filter on (a value in one of the attribute columns, such as an agent name)
- Click Filter on Selections.
The View Filter Editor appears, where you can modify the filter as needed.
Drilling in report data

You can drill on report data to see more detailed (or more general) information.
- To drill on a report, first open and run the report.
- Right-click a heading in the report; a context menu opens. If it is possible to drill on the metric on which you have clicked, Drill appears in the menu.
The choices available vary depending on the type of data on which you click ('Drill down to Agent Name', 'Drill up to Month', 'Drill down to Interaction subtype', and so on). Not all data can be drilled. For example, right clicking the heading Day (in reports where that heading appears, such as Agents > Agent Utilization Report) gives you the option to drill to another time period, such as Month or Year. Arrows in the menu indicate whether a drill option is drilling 'Up' or drilling 'Down'. - Select one of the drill actions that appear. The report automatically updates to account for the change. Open the Drill menu again; the available options have now changed.
For more comprehensive drill options, click the Data menu, and select Drill. The Drill Editor appears, where you can drill on multiple columns, and access advanced options.
Drill considerations
The ability to drill up or drill down within a report allows you to view results from a wider or narrower perspective, but it's important to understand the logic that Genesys CX Insights applies when you drill, as there are some cases where data can seem to disappear after you drill, or you see data that is not what you might expect.
Drilling occurs along the attribute hierarchies, for example, up from Agent to Agent Group, or down from Agent Group to Agent:
- Agent hierarchy: Agent Group ←→ Agent Name
- Campaign Group hierarchy:Campaign Group ←→ Campaign
- Interaction hierarchy: Interaction Type ←→ Interaction Subtype
- Service Type hierarchy: Service Type ←→ Service Subtype
- Time Interval hierarchy: Year ←→ Quarter ←→ Month ←→ Day ←→ Hour ←→ 30 minutes
- Queue hierarchy: Queue Group ←→ Queue
Unexpected results can occur in various situations, such as:
- When you run a report with date prompts for a specific sequence of days, and then drill up to a longer period of time, the report shows data for the entirety of of the new period; however, this works only if the specific sequence of days includes the starting DATE_TIME_KEY for the time period to which you drill. Otherwise, the report can return no data. For example, if you initially run a report over a the 1st - 5th of the month, and then drill up to the month level, the report takes in data from the rest of the month. However, if you run it over another five day period -- say the 5th - 10th, and then drill up, the report returns no data.
- When agent-campaign results are displayed, drilling down from campaign to campaign group and then drilling up from agent to agent group can result in duplicate rows.
- Drilling down from aggregated results to the interaction- or interaction-segment level is not supported. (This is different from drilling along the Interaction hierarchy, which is based on interaction type and subtype (for example, Inbound/InboundNew), not on the legs of the interaction.)
Printing or exporting report data

You can easily export your reports to a variety of formats, including PDF (useful for printing) or Excel/CSV (useful if you want to take the data into other applications or manually edit the output).
- Click Report Home > Export > PDF.
The PDF options page appears in a new browser tab. - Optionally, select options to control how the report will be exported, such as page size, orientation, or other aspects of formatting. For many reports, it is a good idea to select Fit to 1 Pages Wide and Landscape.
- Click Export. The PDF opens automatically in the browser tab. If you are happy with the output, you can click Download (to save the file) or Print.
Some users find it useful to export data to a spreadsheet format, as it is then possible to more easily sort and view the data, particularly if there is a lot of data in your report, due to the larger screen area available in a spreadsheet application, such as Microsoft Excel. This is particularly true if you have a great deal of data in your report, or in the case of reports that just can't easily fit in a browser window because they contain many columns or rows.
Scheduling the delivery of reports

You can run a report regularly--every day, or every week, for example. Genesys CX Insights enables you to create Subscriptions, which schedule the delivery of one or more reports into your Genesys CX Insights History List, or send them to you automatically by email or SFTP.
Schedule email delivery
To schedule the delivery of a report by email, first define an email address, and then subscribe to the report using that address:
- Log in to CX Insights.
- Click your user name, select Preferences, and click E-mail Addresses.
- In the Email Addresses list, click Add a New Address. Enter the Address Name (a short name to identify the account), the Physical Address (the email address), and choose the Device. This is the email type, such as Outlook.
- Click Save.
- In the breadcrumbs, click CX Insights to return to the Home page.
- Open the Shared Reports folder, and navigate to the report you want to schedule.
- Hover over the report name/description, and several options appear below the description. Click Subscriptions.
- On the My Subscriptions page, scroll down and click Add email subscription. The E-mail Subscription options appear, as shown in the adjoining figure.
- Choose an option from the Schedule, and To lists. You can add more than one recipient in the To list.
- Optionally, test the subscription by selecting Send a preview now (if you do, an email typically arrives within a few minutes). Click OK.
If you create a subscription for a user who is, or later becomes, disabled, MicroStrategy does not send the report to that user, though it continues to send it to other subscribers.
In release 9.0.010 or later, if you have created subscriptions for a user, use the following steps to transfer those subscriptions to another user (without having to recreate them from scratch):
- Open MicroStrategy Products > Command Manager. A log-in dialog appears.
- Log in as user who is a member of both the General Developers group and the General Users Administrators group.
- Enter the following command into a script:
ALTER EMAILSUBSCRIPTION "<subscription_name>" OWNER "<user_name>" IN PROJECT "<project_name>";
- For example:
ALTER EMAILSUBSCRIPTION "Agent Conduct Report 3/21/19 2:30:15 PM" OWNER "Administrator" IN PROJECT "CX Insights";
- On the menu, click Connection > Execute.
For information about user groups (including General Developers group and the General Users Administrator) see the Genesys CX Insights Deployment Guide. If you have difficulty, contact Genesys Customer Care for assistance.
Schedule FTP delivery
Beginning with release 100.0.021.00, Genesys CX Insights supports scheduled delivery of the standard reports using FTP / SFTP.
- Configure FTP delivery by setting FTPDEF* variables in gcxi.properties, for example:
FTPDEF1=DeviceName=myFTP1;Protocol=2;ServerName=ftp_server_name_1;Port=22;RemoteDir=/subs/files/location;UserName=user_name_with_access;FTPServerPassword=password;CreateFolders=true;AppendUserPath=true;OverwriteFiles=false;AppendToFile=false;AppendTimestampToFileName=true;UseBackUpLocation=false;PassiveMode=false;MaxConnections=-1

FTPDEF2=DeviceName=myFTP2;Protocol=2;ServerName=ftp_server_name_2;Port=22;RemoteDir=/GCXi/files/location;UserName=user_name_with_access;FTPServerPassword=;CreateFolders=true;AppendUserPath=true;OverwriteFiles=false;AppendToFile=false;AppendTimestampToFileName=true;UseBackUpLocation=false;PassiveMode=false;MaxConnections=-1
- In MicroStrategy Developer:
- From the Developer Folder List, expand Administration, expand Delivery Managers, and select Devices.
- Right-click in the Device List area, select New, and then Device.
- Select FTP and click OK.
- Select SFTP as the protocol type, and enter the information required to connect to your SFTP server.
- Click OK.
- If you are previously authenticated into Genesys CX Insights, you must refresh your login session to make the device available.
- In Genesys CX Insights:
- Open the Shared Reports folder, and navigate to the report you want to schedule.
- Hover over the report name/description, and several options appear below the description. Click Subscriptions.
- On the My Subscriptions page, scroll down and click Add FTP subscription. The FTP Subscription options appear.
- Enter appropriate values for Schedule, Location, Delivery Format, and other values as required.
- Click OK.
- Optionally, you can provide FTP credentials using the file gcxi-secrets.yaml. For example:
<...>
 FTPDEF1__FTPServerPassword: <password1>
 FTPDEF2__FTPServerPassword: <passwords>
 FTPDEF1__UserName: <username>
- where <password1>, <passwords>, and <username> are appropriate values. Note that two underscores are required after the prefix (FTPDEF*__).
- For example:
 FTPDEF1__FTPServerPassword: R2VuZXN5c18w
 FTPDEF2__FTPServerPassword: R2VuZXN5czE=
 FTPDEF1__UserName: Z2N4aQ==
Enabling Languages on the server
Use the following steps to enable a language on the server.
- Execute the following command to back up the GCXI meta db:
kubectl apply -f k8s/gcxi-backup.yaml
- Execute the following command to stop currently running containers:
kubectl scale deploy/gcxi-secondary --replicas=0
kubectl scale deploy/gcxi-primary --replicas=0
- Edit the gcxi.properties file, and add the LANGS variable:
LANGS=<lang_code_1>,<lang_code_2>,..<lang_code_N>
- where each <lang_code> is a value from the table in Supported languages. The first value added (<lang_code_1>) becomes the default language. For example, to make Chinese (simplified) the default language, and enable both German (Germany) and Japanese:
LANGS=zh-CN,de-DE,ja-JP
- Note the following:
- If no value is set for the LANGS variable, en-US is used.
- The default language is controlled by the the first value added to the LANGS variable, and can be any language other than en-US. If you wish to use en-US as the default, make any other language the default, and then change the language using the steps in Changing the language used in the reports.
- When upgrading to a later GCXI release in scenarios where you have set a default value other then en-US, you must set a value for the LANGS variable in gcxi-properties, or GCXI will revert to en-US for the default language. However, user preferences (as set in Changing the language used in the reports) are preserved after an upgrade.
- The format of the <lang_code> variables changed beginning in release 9.0.010.
- Execute the following command to load gcxi.properties into Kubernetes:
kubectl delete configmap gcxi-config
kubectl create configmap gcxi-config --from-env-file=k8s/gcxi.properties --namespace genesys
- Execute the following commands to start the PRIMARY container:
kubectl scale deploy/gcxi-primary --replicas=1
- Wait until PRIMARY is done (wait until Tomcat is up, and MicroStrategyWeb page is available).
- Execute the following command to start the SECONDARY container:
kubectl scale deploy/gcxi-secondary --replicas=1
- Users can now change the language. (See Changing the language used in the reports.)
Note the following:
- When you enable a language on the server, the reports and GUI are automatically switched to that language.
- When non-administrative users change language preferences, they will see a list of language choices that includes languages you have not enabled; to avoid confusion, if users will need to switch languages, you should notify them about what language you have enabled for them to use.
- As an administrator, you can optionally change language default settings for all users; log in as an administrator, and click Preferences -> Project Defaults -> General.
Supported languages
Genesys CX Insights provides support to translate (localize) the GUI and Genesys CX Insights reports. See the appropriate table to match your deployment:
- Language support for the Genesys CX Insights project
- Language support for the Genesys CX Insights for iWD project
| Language | LANGS variable value |
|---|---|
| Arabic (release 9.0.010.04 and later) | ar-SA |
| Chinese (simplified) | zh-CN |
| Dutch (release 9.0.014 and later) | nl-NL |
| French (Canada) | fr-CA |
| French (France) | fr-FR |
| German (Germany) | de-DE |
| Italian | it-IT |
| Japanese | ja-JP |
| Korean (release 9.0.010.04 and later) | ko-KR |
| Polish (release 9.0.014 and later) | pl-PL |
| Portuguese (Brazil) | pt-BR |
| Russian | ru-RU |
| Spanish (Latin America) | es-419 |
| Turkish | tr-TR |
Support for localization of the Genesys CX Insights for iWD is available in release 9.0.014 and later.
| Language | LANGS variable value |
|---|---|
| Chinese (People's Republic of China) | zh-CN |
| German (Germany) | de-DE |
| French (Canada) | fr-CA |
| French (France) | fr-FR |
| Japanese (Japan) | ja-JP |
| Portuguese (Brazil) | pt-BR |
| Russian (Russia) | ru-RU |
| Spanish (Mexico) | es-MX |
In release 9.0.013 and earlier, you cannot change the language used in Gensys CX Insights for iWD reports.
Changing the language used in the reports

Before you can select a language, an administrator must enable it on the server. Only one language, in addition to US English, is enabled at any time. Talk to your administrator to find out what language is available for your use (or see Enabling Languages on the server). Changes described in this procedure apply only to your own sessions, not to other users.
Use the following steps to change the language used in the GUI and reports.
- Log in to Genesys CX Insights.
- Click the drop-down menu next to your user name, and select Preferences.
- On the User Preferences > General page:
- Change the language used in the GUI: In the Language section, select a language from the list.
- Change the language used in the reports: Click Show advanced options, from the Metadata list, select a language.
- Scroll to the bottom of the page, and click Apply.
- Use the browser's back arrow, or click in the breadcrumbs, to continue.
Video: Change the language used in reports
This video describes how to change the language used in reports in Genesys CX Insights.
Where can I learn more?

In addition to the Genesys CX Insights documentation, extensive MicroStrategy Product Documentation is available. (MicroStrategy is the engine that drives Genesys CX Insights.) See links to specific MicroStrategy wiki pages on the Additional Resources page in this document.
- For context-sensitive help to explain the options you see on the Genesys CX Insights GUI, click the ? next to the editor for which you want more information.
- For advanced users seeking detailed information, click the menu next to your user name, and click Help to access the latest online MicroStrategy user guides and manuals.