Weekly Agent Group Utilization Dashboard
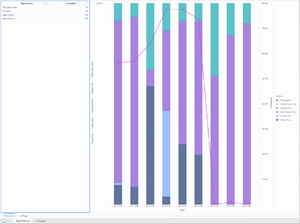
The (Dashboards and Agents folders) Weekly Agent Group Utilization Dashboard provides visualizations you can use to understand how much of agent total active time was spent in each state.
Understanding the Weekly Agent Group Utilization Dashboard
The Weekly Agent Group Utilization Dashboard charts agent occupancy against a breakdown of the duration of the different states that an agent can be in (Ready, Not Ready, Busy, Other, and Wrap) as percentages, fully accounting for the interaction time (time spent handling interactions) for the agents in the group.
To get a better idea of what this dashboard looks like, view sample output from the dashboard:
SampleWeekly Agent Group Utilization Dashboard .pdf
The following tables explain the prompts you can select when you generate the dashboard, and the metrics and attributes that are represented in the dashboard:
Prompts available for the Weekly Agent Group Utilization Dashboard
The following table lists the prompts available for the Weekly Agent Group Utilization Dashboard:
| Prompt | Description |
|---|---|
| Pre-set Date Filter | From the convenient list of predefined dates, choose a date for which to run the report. |
| Start Date | Choose the first day from which to gather data into the dashboard. |
| End Date | Choose the last day from which to gather data into the dashboard. |
| Agent Group | Optionally, select one or more agent groups on which to focus the report. |
| Media Type | Optionally, select one or more media types to include in the report—for example, VOICE, EMAIL, and CHAT. |
| Interaction Type | Optionally, select the type of interaction to include in the report—for example, Inbound, Outbound, and Internal. |
| Tenant | For multi-tenant environments, optionally select one or more tenants on which to focus the report. |
Attributes used on the Weekly Agent Group Utilization Dashboard
The following table lists the attributes used on the Weekly Agent Group Utilization Dashboard:
| Attribute | Description |
|---|---|
| Agent Group | Click values in this column to focus the report on specific groups. |
| Week | Enables data within the reporting interval to be organized by a particular week (1-53). |
Metrics used on the Weekly Agent Group Utilization Dashboard
The following table lists the metrics used on the Weekly Agent Group Utilization Dashboard:
| Metric | Description |
|---|---|
| Accepted | The total number of times that customer interactions or warm consultations were accepted, answered, pulled, or initiated by agents who belong to this agent group. |
| % Occupancy | The percentage of time that this agent’s state was Busy within the interval, relative to the total duration within the interval of the agent’s active session on a particular media channel.
This metric reflects the percentage of time that agents actually spent handling interactions against their available or idle time. This metric is computed as active time minus ready and not-ready time divided by the difference of active and not-ready time. |
| % Other State Time | The percentage of the agent's time spent in a state other than those listed in the report. |
| % Ready Time | The percentage of time within the interval that this agent’s state was Ready, relative to the total duration within the interval of the agent’s active session on a particular media channel. |
| % Not Ready Time | The percentage of time within the interval that this agent’s state was NotReady, relative to the total duration within the interval of the agent’s active session on a particular media channel. |
| % Wrap Time | The percentage of time that this agent spent in ACW (Wrap) state within the interval, relative to the total duration of the agent’s active session within the interval. |
| % Busy Time | The percentage of time of all interaction-processing activities. |
To view more detailed information about the metrics and attributes in this dashboard, and other metrics and attributes that can be used to customize reports, see the Genesys CX Insights Projects Reference Guide.

