Contents
Final Disposition Dashboard
This page describes how you can use the (Dashboards > and Designer > folder) Final Disposition Dashboard to analyze trends in interaction outcomes by viewing detailed information over time periods you specify, about the number and percentage of interactions that enter the Designer Application and conclude in the Self-Service phase, compared to the number that enter the Assisted-Service phase and are routed to a DN or agent.
Note that the term dashboard is used interchangeably with the term dossier. Dashboards / dossiers provide an interactive, intuitive data visualization, summarizing Key Performance Indicators (KPIs). You can change how you view the data in most reports and dashboards by using interactive features such as selectors, grouping, widgets, and visualizations. You can explore data through multiple paths, using text and data filtering, and layers of organization.
Understanding the Final Disposition Dashboard
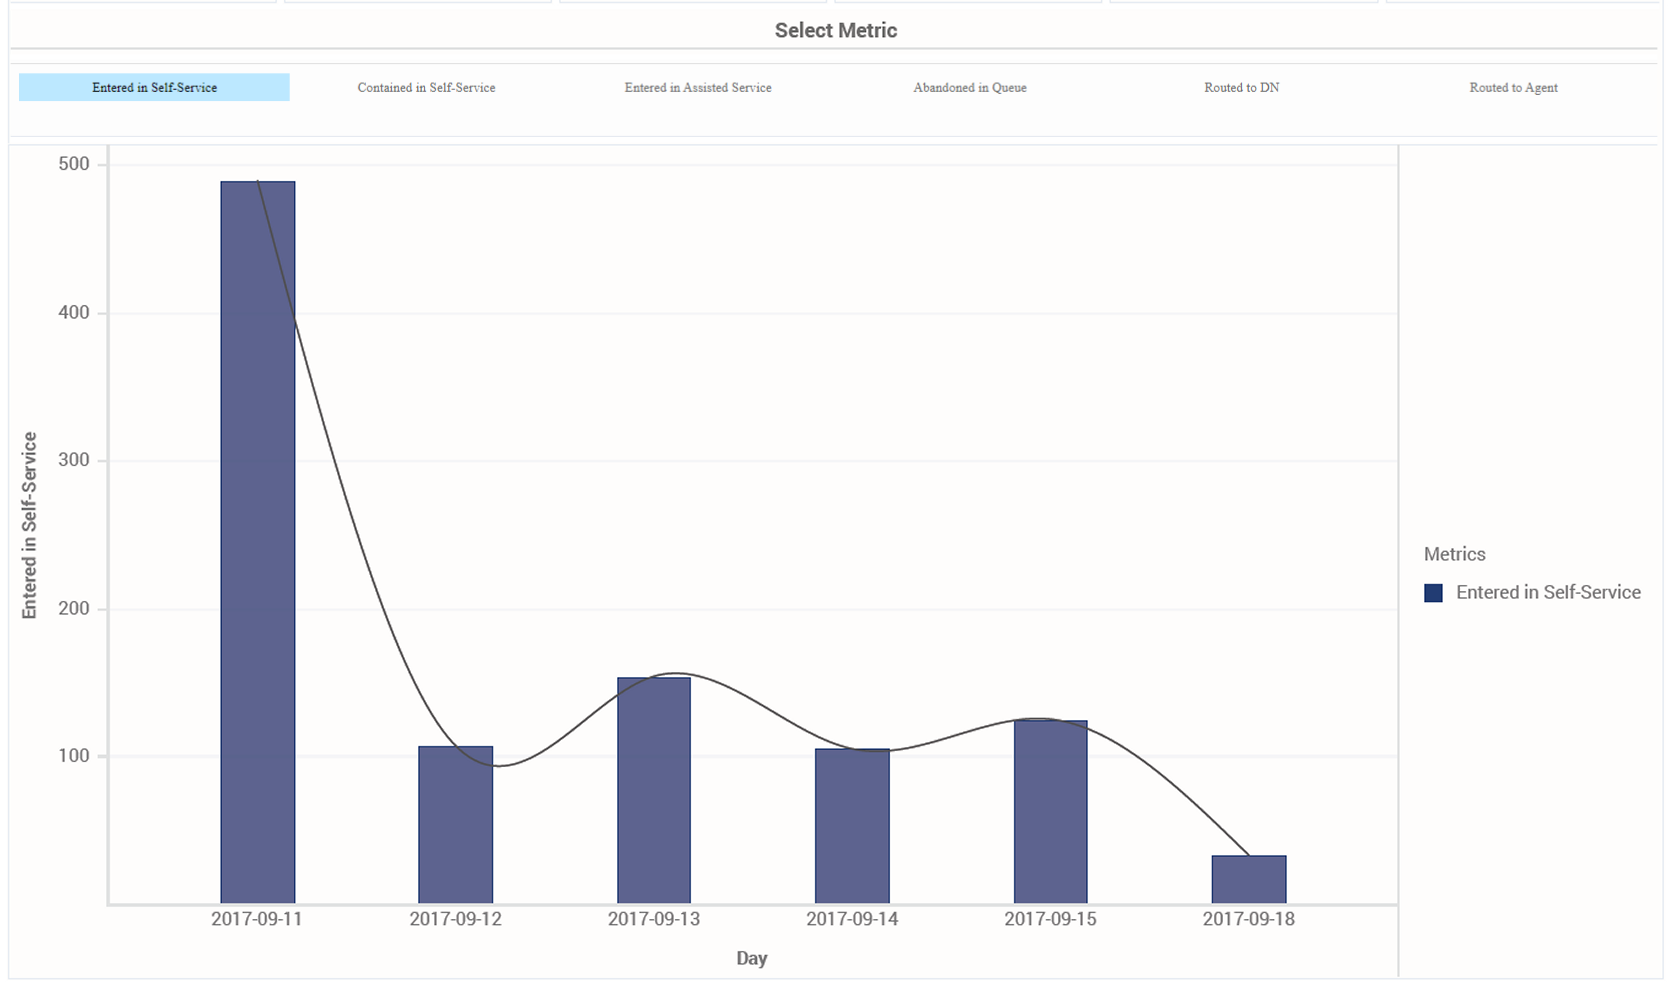
This dashboard is designed to provide an overview of interaction outcomes by visualizing key KPIs over time, which can help you spot trends in customer outcomes.
Use this dashboard to compare today's numbers to previous days. By default, the dashboard shows the past week, but you can run it across longer periods of time. In the Select Metric bar, choose which metric to view in the bar chart.
To get a better idea of what this dashboard looks like, view sample output from the dashboard:
HRCXIFinalDispositionDashboard.pdf
The following tables explain the prompts you can select when you generate the dashboard, and the attributes and metrics that are represented in the dashboard:
Prompts for the Final Disposition Dashboard
| Prompt | Description |
|---|---|
| Pre-set Date Filter | From the list, choose a time period on which to report, and move it to the Selected list. |
| Start Date | Choose the first day from which to gather report data. |
| End Date | Choose the last day from which to gather report data. |
| Application | Choose an application on which to focus the report. |
Attributes used in the Final Disposition Dashboard
| Attribute | Description |
|---|---|
| Application Name | This attribute enables data to be organized by application. |
| Day | This attribute enables data to be organized by day. |
| Hour | This attribute enables data to be organized by hour. |
| Month | This attribute enables data to be organized by month. |
| Week | This attribute enables data to be organized by week. |
| Subhour | This attribute enables data to be organized by 15 / 30 minutes intervals. |
Metrics used in the Final Disposition Dashboard
| Metric | Description |
|---|---|
| Abandoned in Queue | The total number of interactions that entered the Self-Service phase of the Designer application, requested Assisted-Service, and were subsequently abandoned while waiting in queue. |
| Contained in Self- Service | The total number of interactions that entered the Designer application in Self-Service and were concluded without entering Assisted-Service. |
| Entered in Assisted Service | The total number of interactions that entered the Designer application in Assisted-Service. |
| Entered in Self- Service | The total number of interactions that entered the Designer application in Self-Service. |
| Routed to Agent | The total number of interactions that entered the Self-Service phase of the Designer application and were later routed to an agent. |
| Routed to DN | The total number of interactions that entered the Self-Service phase of the Designer application and were later routed to a DN. |
To view more detailed information about the metrics and attributes in this dashboard, and other metrics and attributes that can be used to customize reports, see the Genesys CX Insights Projects Reference Guide.

