Queue Duration and Priority Dashboard
The Queue Duration and Priority Dashboard provides several visual breakdowns of the average time spent to complete tasks.
Each tab of the dashboard tracks tasks from inception within the presource system, through to completion within iWD, and provides insights into average task durations at defined milestones along a task’s distribution path. It also allows you to analyse tasks based on ranges of queue priorities and, various processing milestones from which tasks were distributed or proceeded through prior to completion.
The dashboard report organizes data on the following tabs:
- Summary tab — An overview of the time interactions spent in queue.
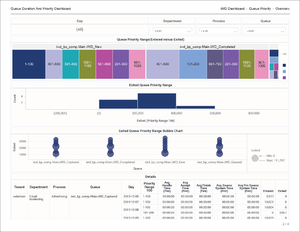
- Queue Priority tab — Insights you can use to tune the priorities in the rules system and routing strategies in order to reduce average durations at processing milestones. This report is particularly useful if you manage your operations around service level-based or business outcome-based priorities.
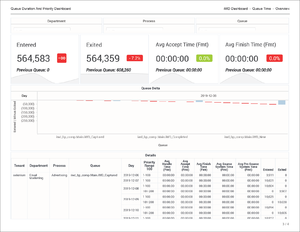
- Queue Time tab — Insight into the movement of tasks through the iWD system, thereby troubleshooting business rules and routing strategies.
- Queue Depth tab — Insights into pending volumes.
Note that the term dashboard is used interchangeably with the term dossier. Dashboards provide an interactive, intuitive data visualization, summarizing key business indicators (KPIs). You can change how you view the data in most reports and dashboards by using interactive features such as selectors, grouping, widgets, and visualizations, and explore data using multiple paths, through text and data filtering, and layers of organization.
To get a better idea of what this dashboard looks like, view sample output from the report:
Sample Queue Duration and Priority Dashboard.pdf
The following table explains the prompts you can select when you generate the Queue Duration and Priority Dashboard:
| Prompt | Description |
|---|---|
| Pre-set Date Filter | Choose from the convenient list of predefined rolling time ranges, spanning one day or more, over which to run the report. |
| Start Date | Choose the first day from which to gather report data. |
| End Date | Choose the last day from which to gather report data. |
| Department | Optionally, select a department on which to focus the report. |
| Process | Optionally, select a business process on which to focus the report. |
| Queue | Optionally, select a queue on which to focus the report. |
| Tenant | Optionally, select a tenant on which to focus the report. |
The following table explains the attributes used in the Queue Duration and Priority Dashboard:
| Attribute | Description | Data Mart Column |
|---|---|---|
| Day | Enables data within the reporting interval to be organized by a particular day within a month and year. Day values are presented in YYYY-MM-DD format. | DATE_TIME.LABEL_YYYY_MM_DD |
| Department | Enables data to be organized by the name of the department for which iWD prioritizes and routes tasks. | DEPARTMENT.DEPARTMENT_NAME |
| Process | Enables data to be organized by the name of the business process, which is a core attribute of tasks and work items that define strategies for how to route them. | PROCESS.PROCESS_NAME |
| Queue | Enables data to be organized by the name of the interaction queue, agent workbin, agent group workbin, place workbin, or place group workbin into which tasks or work items entered. | QUEUE.QUEUE_NAME |
| Tenant | Enables data within the reporting interval to be organized by tenant. | TENANT.TENANT_NAME |
The following table explains the metrics used in the Queue Duration and Priority Dashboard:
| Metric | Description | Source or Calculation |
|---|---|---|
| Priority Range 100 | Enables data to be organized by the range (granularity of 100) in which the task’s priority falls. You can drill along this attribute to display larger ranges in which task priorities fall. Ranges are character values that have a granularity of 100, for example: “1–100”, “101–200”, and so on. For information about customization, see Customizing the dashboard. | PRIORITY.PRIORITY_RANGE |
| Avg Handle Time (Fmt) | The average amount of time that agents worked on tasks that were distributed from this queue before they were completed. | Calculated based on the value of the Handle Time and Finished metrics, where:
|
| Avg Accept Time (Fmt) | For completed tasks that were distributed from this queue, the average amount of time that elapsed within the iWD system before the tasks were assigned to a resource for the first time. This metric reflects how long, on average, tasks were backlogged. | Calculated based on the value of the Accept Time and Finished metrics, where:
|
| Avg Finish Time (Fmt) | The average amount of time that elapsed before agents completed tasks that were distributed from this queue. This metric includes the time that tasks were backlogged, as well as work time. | Calculated based on the value of the Finish Time and Finished metrics, where:
|
| Avg Source System Time (Fmt) | For completed tasks that were distributed from this queue, the average amount of time the tasks spent in the preceding system before they were created within iWD. | Calculated based on the Source System Time and Finished metrics, where:
|
| Avg Pre-Source System Time (Fmt) | For completed tasks that were distributed from this queue, the average amount of time the tasks spent in the presource system. | Calculated based on to the Pre Source System Time and Finished metrics, where:
|
| Entered | The total number of new tasks that were distributed from this queue and were submitted to iWD during the reporting interval. | IWD_AGG_TASK_QUEUE_[Y,Q,M,W,D,H,15].ENTERED_TASK_COUNT |
| Exited | The total number of tasks that exited the queue or workbin during the reporting interval. | IWD_AGG_TASK_QUEUE_[Y,Q,M,W,D,H,15].EXITED_TASK_COUNT |


