Task Age Dashboard
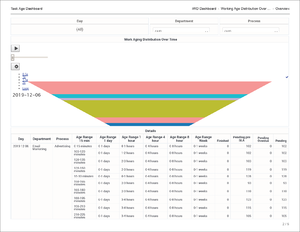
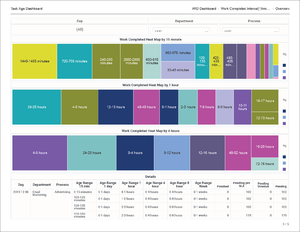
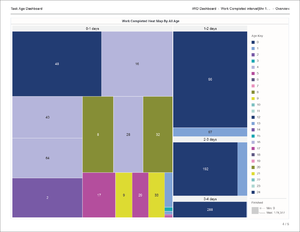
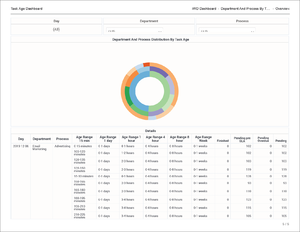
Use the (CX Insights for iWD folder) > Task Age Dashboard to better understand how well each department and process is meeting Service Level Agreements. The dashboard provides detailed information about the volume of tasks that are handled within the defined Service Level interval, and the volume that breach the Service Level Agreement for departments and processes.
This dashboard provides an aging analysis of work, contrasting work that is performed prior to the Service Level being breached with the work that has breached the Service Level Agreement for your departments and processes. This enables you to visualize and analyze how each department and process is meeting their service levels. The dashboard organizes data on the following tabs:
- Summary
- Working Age Distribution Over Time
- Work Completed Interval [15 min]
- Work Completed Interval [8 hr]
- Department And Process By Task Age
Note that the term dashboard is used interchangeably with the term dossier. Dashboards provide an interactive, intuitive data visualization, summarizing key business indicators (KPIs). You can change how you view the data in most reports and dashboards by using interactive features such as selectors, grouping, widgets, and visualizations, and explore data using multiple paths, through text and data filtering, and layers of organization.
To get a better idea of what this dashboard looks like, view sample output from the report:
Sample Task Age Dashboard.pdf
The following table explains the prompts you can select when you generate the Task Age Dashboard:
| Prompt | Description |
|---|---|
| Pre-set Date Filter | Choose from the convenient list of predefined rolling time ranges, spanning one day or more, over which to run the report. |
| Start Date | Choose the first day from which to gather report data. |
| End Date | Choose the last day from which to gather report data. |
| Department | Optionally, select a department on which to focus the report. |
| Process | Optionally, select a business process on which to focus the report. |
| Tenant | Optionally, select a tenant on which to focus the report. |
| Media Type | Optionally, select one or more media types for which to gather data into the report. |
The following table explains the attributes used in the Task Age Dashboard:
| Attribute | Description |
|---|---|
| Day | Enables data within the reporting interval to be organized by a particular day within a month and year. Day values are presented in YYYY-MM-DD format. |
| Department | Enables data to be organized by the name of the department for which iWD prioritizes and routes tasks. |
| Process | Enables data to be organized by the name of the business process, which is a core attribute of tasks and work items that define strategies for how to route them. |
| Age Range 15 min | Enables data within the reporting interval to be organized by the age of the task, where age has a granularity of 15-minutes ranges. For information about customization, see Customizing the dashboard. |
| Age Range 1 day | Enables data within the reporting interval to be organized by the age of the task, where age has a granularity of 1 day ranges. |
| Age Range 1 hour | Enables data within the reporting interval to be organized by the age of the task, where age has a granularity of 1-hour ranges. |
| Age Range 4 hour | Enables data within the reporting interval to be organized by the age of the task, where age has a granularity of 4-hours ranges. |
| Age Range 8 hour | Enables data within the reporting interval to be organized by the age of the task, where age has a granularity of 8-hours ranges. |
| Age Range Week | Enables data within the reporting interval to be organized by the age of the task, where age has a granularity of 1 week ranges. |
The following table explains the metrics used in the Task Age Dashboard:
| Metric | Description |
|---|---|
| Finished | The total number of tasks of this classification that were completed during the reporting interval. |
| Pending pre SLA | The number of pending tasks that are not overdue. Calculated as the difference between the total count of pending tasks, and the total count of overdue tasks. |
| Pending Overdue | The current number of pending tasks that were overdue at the end of the reporting interval. A task is considered overdue when the SLA due date/time has been missed. |
| Pending | The current number of tasks that were pending (where the task status is Queued, Assigned, or Held) at the end of the reporting interval. |
To view more detailed information about the metrics and attributes in this report, and other metrics and attributes that can be used to customize reports, see the Genesys CX Insights Projects Reference Guide.
Customizing the dashboard
Some dashboards contain attributes representing different granularity of an attribute, such as Age Range, or Business Value. You can change the granularity of the data shown on the dashboard by replacing this attribute with another; this procedure uses Business Value Range in the Capture Point Dashboard as an example (or see the video below).
Procedure: Changing the granularity of the dashboard data
Purpose: Change the Business Value Range. By default, the Capture Point Dashboard is configured to use the "Business Value Range 100" attribute.
Steps
- Log in with an account having Administrator privileges.
- Open and run the dashboard.
- Complete the following steps to make a copy of the dashboard, rather than modify the original:
- Click File > Save As.
- In the Save As editor:
- In the Save in list, choose one of the following paths:
- Shared Reports > Custom — to make the modified dashboard accessible to other users.
- My Reports — to make the modified dashboard accessible only to you.
- Enter a Name for the report, and optionally modify the Description, or Advanced Options.
- Click OK.
- In the Save in list, choose one of the following paths:
- In the Dossier Saved editor, click Run newly saved dossier.
- You can now modify the dashboard:
- From the View menu, click Datasets Panel.
- The Datasets Panel appears, where you can select a new Business Value Range to apply.
- Right-click the existing attribute value (Business Value Range 100 by default), and in the menu that appears, choose Replace Reference With.
- Click the name of the dataset object to insert (for example Business Value Range 1000).
- The selected dataset attribute replaces the default Business Value Range 100 attribute.
- From the View menu, click Datasets Panel.
- Click File > Save to save your changes, and rerun the report to verify the results.
Video: Changing the granularity of the dashboard data
This video describes how to customize the Business Value Range.


