
Contents
Milestone Path Analysis Dashboard
The (Designer folder) Milestone Path Analysis Dashboard provides detailed information and visualizations illustrating the first and last milestones customers traversed, and the number of sessions that ended in each final disposition.
Understanding the Milestone Path Analysis Dashboard
The Milestone Path Analysis Dashboard is divided into two tabs:
- Milestone Analysis tab — Views on this tab allow you to explore the first and last milestones users encountered and the number of sessions that terminate in each configured outcome (Final Disposition). This tab offers four dynamic, interactive views:
- Data View — Detailed information about the number of sessions, first and last milestones, and disposition.
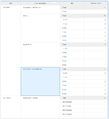
- Visual View — This sankey diagram view provides an interactive visual representation that explores the session count from the first milestone to the last milestone, including the disposition. Hover over visual elements to learn what each number represents, or use the Filter option to focus on particular milestones or days. Optionally, you can edit the dashboard to show full text labels, instead of only values.
- Final Dispositions — Detailed and visual representations of the number of sessions that reached each Final Disposition. Hover over visual elements to learn what each number represents, or use the Filter option to focus on particular milestones or days.
- Last Milestone View — Detailed information, sorted by day, about the Last Milestone sessions passed before completion. Optionally, remove the Day attribute from this view, to organize data by Final Disposition.
- Views on the Milestone Analysis tab
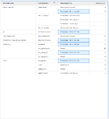
Data View

Sankey View
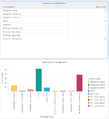
Final Disposition
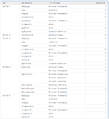
Last Milestone View


- ANI Analysis tab — Detailed information about the Final Disposition for each caller, based on Automatic Number Identification (ANI), and sorted by day. Use the Filter option to focus on specific ANIs, or add additional columns.
- Views on the ANI Analysis tab
Final Disposition

To get a better idea of what this dashboard looks like, view sample output from the dashboard:
SampleMilestonePathAnalysisDashboard.pdf
The following tables explain the prompts you can select when you generate the dashboard, and the metrics and attributes that are represented in the dashboard:
Prompts for the Milestone Path Analysis Dashboard
| Prompt | Description |
|---|---|
| Pre-set Date Filter | From the convenient list of predefined dates, choose a date for which to run the report. |
| Start Date | Choose the first day from which to gather data into the dashboard. |
| End Date | Choose the last day from which to gather data into the dashboard. |
| Application | Optionally, select one or more Designer applications on which to focus the report. |
Attributes used in the Milestone Path Analysis Dashboard
| Attribute | Description |
|---|---|
| ANI | Enables data to be organized by the Automatic Number Identification (ANI), which is the number associated with the originator of the call. |
| Day | Enables data to be organized by day. |
| Start Milestone | Enables data to be organized by the name of the first milestone the call passed. |
| Last Milestone | Enables data to be organized by the name of the last milestone the call passed before entering Assisted Service. |
| Final Disposition | Enables data to be organized by the status assigned to a call when the caller exited the call flow (such as Abandoned in Self-service, Abandoned in Queue, Routed to Agent, System Error, Terminated, or Other). This status is set by the system. |
Metrics used in the Milestone Path Analysis Dashboard
| Metric | Description |
|---|---|
| Session Count | The total number of sessions that encountered each milestone or milestone path. |
To view more detailed information about the metrics and attributes in this dashboard, and other metrics and attributes that can be used to customize reports, see the Genesys CX Insights Projects Reference Guide.