Contents
Inbound Voice Report
View information about Named and Concurrent Users Count usage.
Understanding the Inbound Voice User Report
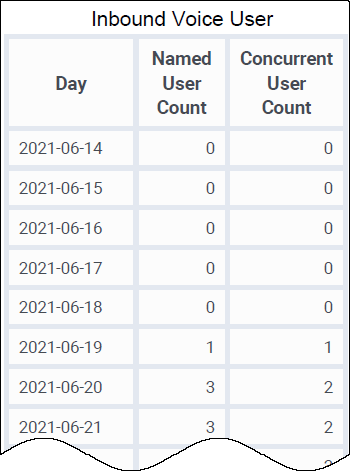
This report provides detailed information about the Named and Concurrent Users Count usage during the selected period. You can drill on the Named User metric to see the discrete users associated with the count.
To get a better idea of what this report looks like, view sample output from the report:
SampleInboundVoiceUserReport.pdf
The following tables explain the prompts you can select when you generate the report, and the metrics and attributes that are represented in the report:
Prompts for the Inbound Voice User Report
| Prompt | Description |
|---|---|
| Pre-set Day Filter | Choose from the convenient list of predefined rolling time ranges, spanning one day or more, over which to run the report. |
| Start Date | Choose the first day from which to gather data into the report. |
| End Date | Choose the last day from which to gather data into the report. |
Attributes in the Inbound Voice User Report
| Attribute | Description |
|---|---|
| Day | This attribute enables data within the reporting interval to be organized by a particular day. |
| Region | This attribute enables data within the reporting interval to be organized based on the geographic classification of the call. Possible values include: us, eu, ap. |
| Business Unit | This attribute enables data within the reporting interval to be organized based on business unit. |
Metrics in the Inbound Voice User Report
| Metric | Description |
|---|---|
| Named User Count | The number of agents that logged in for a voice media type at least once during the selected month. This value represents a running total of the number of agents who logged in since the beginning of the calendar month. It resets at the beginning of each month. |
| Concurrent User Count | The peak number of unique agents that were concurrently logged in for a voice media type, during the selected period. Note that, if you run the report over a single day, this value shows you the highest value for that day. If you run the report over a longer period, (month, quarter, year) represents the maximum daily peak within the interval. |
To view more detailed information about the metrics and attributes in this report, and other metrics and attributes that can be used to customize reports, see the Genesys CX Insights 9.0 Projects Reference Guide.

