IWD Reporting
Contents
Overview
With an increasing number of choices in the marketplace and higher expectations of service quality, the ability to measure the efficiency and effectiveness of customer service delivery becomes a key component of success. iWD streamlines an often cumbersome reporting process through:
- Cradle-to-grave reporting from the time that a task enters the contact center until its completion.
- Consolidated reporting across the various systems that are involved in customer-service delivery: fax servers, workflow, customer-relationship management, and Genesys Customer Interaction Management.
- Reporting that is based on business context—with business process, customer segment, and product independent of channel, instead of being limited to interactions, queues, channels, and workflows.
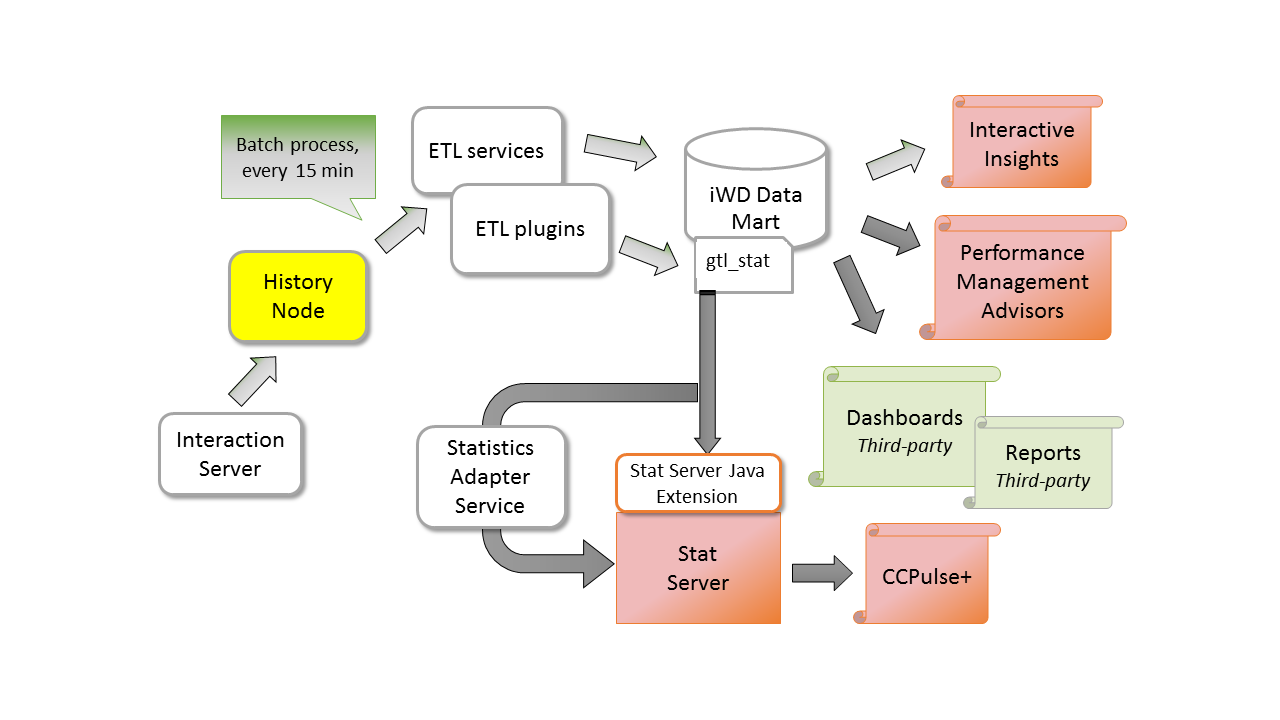
The key to achieving the desired business results is having access to actionable business intelligence. Genesys iWD offers comprehensive reporting, providing management insight into business operation. It provides key indicators of performance both through current-day statistics and on an historical basis. The historical metrics are provided based on aggregates and measures that are populated by scheduled ETL processes, which extract data from the Genesys Interaction Server Event Log database and load it into the iWD Data Mart. This next figure provides a functional overview of iWD’s reporting components. Third-party services can reference iWD statistics from the GTL_STAT table (GTL, for Global Task List) to display data in dashboards or within Genesys CCPulse+.
Database Objects
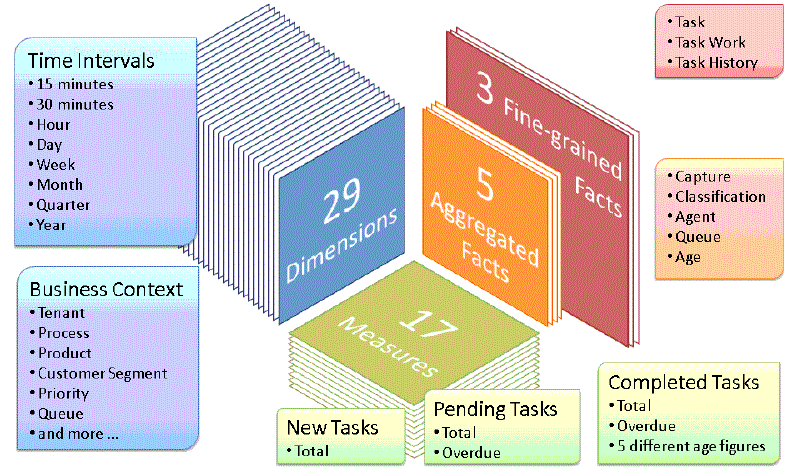
iWD Data Mart consists of the following database objects:
- Fine-grained fact tables—Store all attributes that are associated with tasks (I_TASK_FACT/H_TASK_FACT tables), work-related events (I_TASK_WORK_FACT/H_TASK_WORK_FACT tables), when the task was assigned to one or more agents; and a full audit history of the task (I_TASK_EVENT_FACT/H_TASK_EVENT_FACT tables).
- Aggregated fact tables—Describe tasks in an iWD-oriented context across the various stages, or the iWD life cycle of the task, from capture and classification to distribution to agent.
- Dimensions—Describe task attributes that are common across the fact tables in iWD Data Mart, such as iWD business process, priority, business value, and date and time. Fact tables link to these dimensions through keys.
- Measures—Represent numerical values (such as totals, durations, averages, minimums, and maximums) that are stored in aggregated fact tables across intraday and historical intervals. For example, the total number of completed tasks by 15-minute interval by an iWD process and business value would be captured within the I_TASK_CAPT_FACT_15MIN intraday table.
When they are connected to existing enterprise data marts, including Genesys Info Mart, analysts gain access to comprehensive views of the entire customer experience. Analytical reporting leverages existing business intelligence tools, such as those that are provided by Pentaho (which is an open-source product suite for business intelligence) or through a host of commercial products from Cognos or SAP Crystal Reports.
Reporting Services
The Statistics Adapter Service allows performance of custom aggregations on data and sends the resulting statistics to Genesys Stat Server. Statistics then can be viewed in CCPulse+ or any other Stat Server client.
Historical reporting is enabled by a number of ETL jobs that transform and load iWD runtime data into a separate reporting database that is called the iWD Data Mart for a list of preconfigured ETL jobs). Essentially, the iWD Data Mart is a set of star schemas that contain historical iWD data that is optimized for reporting. The ETL jobs are set up as scheduled services in iWD. Refer to the iWD 9.0 Data Mart Reference Guide for more information.
Statistics for a Chosen Dimension Available Through Stat Server
The list of statistics coming from iWD Data Mart that are available in Stat Server is as follows:
- GTL_ACTIVE—Number of active tasks for each department and process configured in the system.
- GTL_HELD—Number of held tasks for each department and process configured in the system.
- GTL_PENDING_15MIN—Number of pending tasks, as of the trailing 15-minute interval, for each department and process.
- GTL_OVERDUE_15MIN—Number of overdue tasks, as of the trailing 15-minute interval, for each department and process.
- GTL_NEW_15MIN—Number of new tasks, as of the trailing 15 minute interval, for each department and for the solution.
- GTL_NEW_30MIN—Number of new tasks, as of the trailing 30 minute interval, for each department and for the solution.
- GTL_NEW_60MIN—Number of new tasks, as of the trailing 60 minute interval, for each department and for the solution.
- GTL_COMPLETED_15MIN—Number of completed tasks, as of the trailing 15 minute interval, for each department and for the solution.
- GTL_COMPLETED_30MIN—Number of completed tasks, as of the trailing 30 minute interval, for each department and for the solution.
- GTL_COMPLETED_60MIN— Number of completed tasks, as of the trailing 60 minute interval, for each department and for the solution.
In addition to the above statistics, a set of filters is created—for each Solution, Department and Process there is one filter created. The filter definition looks like this:
- Filter name—GTL_<object type>_<object runtime id>
- The object type can be one of these values:
- SLT
- DPT
- PRC
- For example, the filter name for a Process with runtime ID T2_C3_P4 is:
T2_C3_P4: GTL_PRC_T2_C3_P4
- Filter definition—PairExists("Dimension", "<object type>_<object runtime id>")
- For example, the filter definition for a Process with runtime id = T2_C3_P4 is:
PairExists("Dimension", "PRC_T2_C3_P4")


