Genesys_CX_Insights
Genesys Customer Experience Insights (Genesys CX Insights or sometimes GCXI) provides a presentation layer that extracts data from the Genesys Info Mart database, and presents it in readable historical reports to enable business and contact center managers to make better business decisions for streamlining operations, reducing costs, and providing better services.
Genesys CX Insights has replaced Genesys Interactive Insights (GI2) as the historical reporting presentation layer. See also Genesys Info Mart and Reporting and Analytics Aggregates (RAA).
Glossary
Reporting And Analytics Aggregates
Also known as RAA. An optional Genesys Info Mart process that creates and populates predefined aggregation tables and views within an Info Mart database. RAA aggregation tables and views provide the metrics that summarize contact center activity to facilitate reporting, and serves as the primary source of data for the Genesys CX Insights (GCXI) historical reports. RAA is required for Genesys CX Insights, and was required for the now-deprecated GI2.
Glossary
Overview of the Reporting and Analytics Aggregation Layer
RAA provides several aggregate tables to facilitate reporting in (for example) Genesys CX Insights (GCXI), or in your custom reporting applications. The tables (prefixed with AGT_*) store aggregated data for voice, chat, email, SMS, and open media interactions and summarized resource states that occur at voice devices. These tables enable a wider range of reporting than the FACT tables from which they are derived.
Aggregate Data Organization
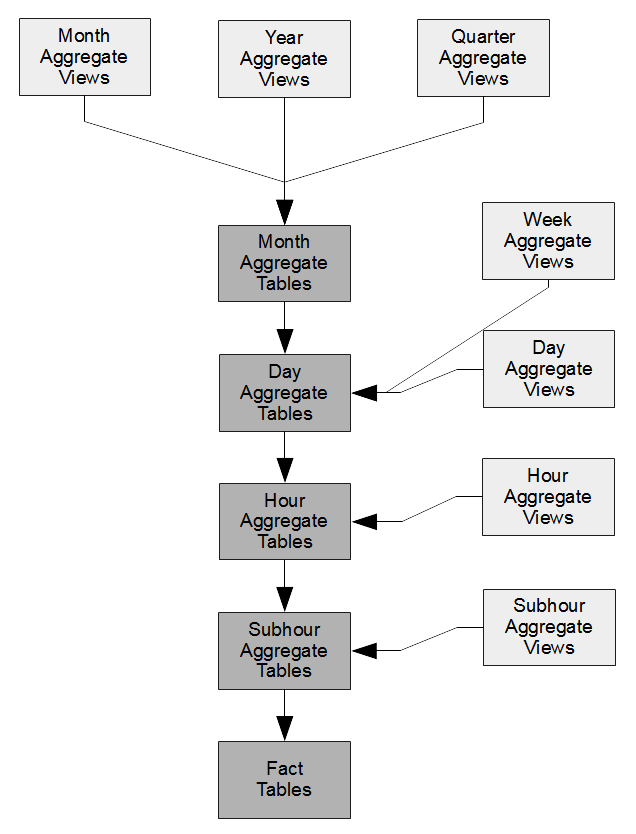
For the disposition-based metrics, tables are provided for hour, day, and month levels; views are provided for the subhour, week, quarter, and year levels. For the interval-based metrics, tables are provided for the subhour, hour, day, and month levels; views are provided for the week, quarter, and year levels.
These models determine to which reporting interval measures are attributed—RAA attributes measure counts and durations in the disposition-based tables to the interval at which the underlying fact started and, for the interval-based model, RAA attributes measures to the interval(s) in which they occurred, whether or not the interactions completed during the interval and whether or not the interval completed.
Counts and durations of such interval metrics are clipped where interactions cross over multiple intervals and are attributed to each of the intervals in which the activities occur. Subhour aggregates for both types provide either 15- or 30-minute aggregations based on user-defined configuration.

