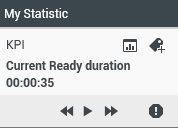
Statistics Gadget
Statistics can be viewed either in the Main Window by selecting the My Statistics tab or the Contact Center Statistics tab in your Workspace, or by using the Statistics Gadget.
The Statistics Gadget might not be enabled in your environment.
The Statistics Gadget displays statistics in two ways:
- A statistics ticker
- A tagged statistic view
The advantage of the Statistics Gadget is that you can view your KPIs and contact center statistics continuously without opening your Workspace and clicking back and forth between tabs.
To show or hide the Statistics Gadget, select Show Statistics Gadget from the Main Menu in the Main Window.
The Statistics Gadget displays configured statistics in a ticking region. Each statistic is displayed for a specified period, then the next statistic is displayed.

Use the Back, Stop/Play, and Forward buttons on the control panel to scroll manually through the statistics that you are configured to view. The buttons are displayed if you are configured to view more than one contact center statistic or KPI.
Alert icons are displayed in the bottom right corner if the statistics are in a warning state or an error state. The background color of the ticker also changes to indicate warning state.
Click the Alert icon on the control panel to display only the statistics that are in warning state or error state.
Click the Tag button (![]() ) to display the current statistics in a static Tagged Statistics view.
) to display the current statistics in a static Tagged Statistics view.
Click the Untag button (![]() ) to close the Tagged Statistics view.
) to close the Tagged Statistics view.
You can view your KPIs either as text or as a graph. Click the Graph View button (![]() ) to view the statistic as a graph. Click the Text View button (
) to view the statistic as a graph. Click the Text View button (![]() ) to view the statistic as a graph.
) to view the statistic as a graph.
You can tag more than one statistic at a time. The Tagged Statistics view expands to accommodate multiple statistics in a single view.
Click the Up and Down buttons to scroll up or down to view other tagged statistics.
Statistics Gadget Menu
To display the Statistics Gadget Menu, place your mouse pointer over the Statistics Gadget. Click the Menu button (![]() ) to open the menu.
) to open the menu.
- Hide My Statistics/Show My Statistics: Shows only the contact center statistics, or shows both My Statistics and the contact center statistics
- Hide Contact Center Statistics/Show Contact Center Statistics: Shows only My Statistics or shows both My Statistics and the contact center statistics
- Always on Top: Keeps the Statistics Gadget on top of all other windows
- Show My Statistics on Main Menu: Opens My Workspace on the Main Window and shows the My Statistics tab
- Hide Contact Center Statistics on Main Menu: Opens My Workspace on the Main Window and shows the contact center-statistics tab
- Close Statistics Gadget: Closes the Statistics Gadget (including the Tagged Statistics stack)
Related Resources
The Workspace Desktop Edition User's Guide (English only) provides detailed lessons for using all the features of Workspace. You might find the following lessons useful:
