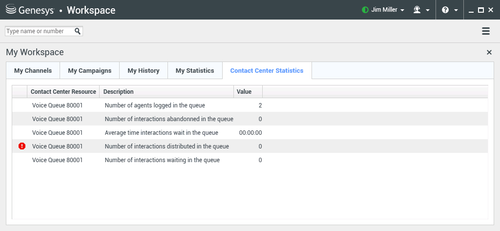
Contact Center Statistics
The list of statistics about the Routing Points, Queues, and other contact center objects is displayed in the Contact Center Statistics tab of the Main Window. You can also view the contact center statistics in the Statistics Gadget.
The Contact Center Statistics tab displays statistics that summarize the state of various conditions that are monitored by your contact center, such as the percentage of abandoned calls, the average call-waiting time, and the number of interactions that are in queue.
The following columns of information are available for each monitored object:
- Contact Center Resource: The name or location of the object
- Description: A description of the contact center statistic
- Value: The value of the contact center statistic
Click column heads to change the sort order of the objects.
Right-click in the Contact Center Statistics view to display the Statistics menu.
Use the Statistics menu to do the following:
- Show or hide statistics
- Show only alerting statistics or show all statistics
Related Resources
The Workspace Desktop Edition User's Guide (English only) provides detailed lessons for using all the features of Workspace. You might find the following lessons useful:

