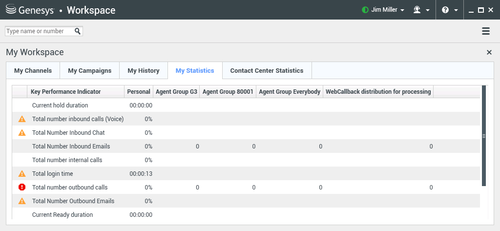
My Statistics
The My Statistics tab of the Main Window displays the list of your Key Performance Indicators (KPIs). You can also access your KPIs in the Statistics Gadget.
The statistics defined as KPIs could also be evaluated for the agent groups of which you are a member. Your performance is displayed in the Personal column, and the statistic value for each Agent Group is displayed in a column with the name of the agent group as the column header.
Click column heads to change the sort order of the KPIs.
The My Statistics tab displays your current KPIs and a summary of the KPIs of your work group(s). The My Statistics tab enables you to compare your performance with the overall performance of the group(s) to which you belong.
A warning icon is displayed in the left-most column of the row. The warning icon is displayed if the evaluation of your performance for the KPI goes beyond the expected warning level for the KPI (![]() ).
).
An error icon might be displayed next to a KPI if the evaluation of the performance is below the expected error level for the KPI
(![]() ).
).
If a statistic has been configured incorrectly, the background of the statistic becomes red and the error icon is displayed. You should report errors immediately. The reason for the problem is displayed in a tooltip if you place your mouse pointer over the problematic statistic row.
Right-click in the My Statistics tab to access the shortcut menu that enables you to show/hide columns and KPIs, and to turn on or off KPI filtering to show only those that have alerts.
- The My Statistics menu enables you to specify which KPIs are displayed. Select a KPI to show or hide it. KPIs that are displayed have a check mark next to them.
- The Agent Groups menu enables you to show or hide the column that contains the KPI values for the agent group. Select a group to show or hide it. Agent Groups that are displayed have a check mark next to them.
- Select Show All statistics to display all of the KPIs. Select Show Only Alerting Statistics to display only KPIs that have warnings or errors. This menu does not affect the columns that are displayed.
Related Resources
The Workspace Desktop Edition User's Guide (English only) provides detailed lessons for using all the features of Workspace. You might find the following lessons useful:

