Contents
Configure Reporting
Knowledge Center Server packages contain the following reporting modules:
- Kibana-based discovery dashboards: allows you to discover different insights of your knowledge data usage
- Predefined Templates and Datasource for native Pulse widgets
This chapter describes how to enable and configure this functionality within your Knowledge Center deployment.
Prerequisites
For Pulse widgets, it is required you use Pulse 8.5.108.02 or higher.
For Kibana dashboards, it is required to use ElasticSearch 6.2.3 version, 6.2.x is supported but not recommended.
Restrictions
Note the following restrictions related to the reporting functionality:
- The basic authentication feature of the Knowledge Center Server must be disabled to allow Pulse to use Knowledge Center data source for widgets (only for versions of 9.0.001.xx family).
- You cannot run two or more nodes of Knowledge Center Server on the same host with reporting functionality enabled (only for versions of 9.0.001.xx family).
- HTTPs for Kibana supported if security proxy enabled (from version 9.0.003.06), or via secured Load-Balancer on top of Genesys Knowledge Cluster (from version 9.0.004.x).
- Taking into account that Pulse is single tenant and does not support Cloud configuration, in multi-tenant environments, each tenant must have its own dedicated Pulse for reporting.
- If you are deploying several Knowledge Center Clusters within one environment, each independent Knowledge Center cluster must have its own dedicated Pulse for reporting.
- In case of standalone Pulse, the base URL should be set as "/gax". For example, set "root_url=/gax" in ./conf/pulse.properties for Pulse installation (only for versions of 9.0.001.xx and 9.0.002.xx family).
Configuration
By enabling the reporting functionality you have to enable the Kibana process that is started and controlled by the Knowledge Center Server on each server Knowledge Center Server runs (Kibana exposes discovery dashboards for Knowledge Center).
To enable reporting functionality in Genesys Knowledge Center you must follow the steps described below:
- Open Genesys Administrator and navigate to Provisioning > Environment > Applications
- Select the application defined for the Knowledge Center Cluster and click Edit
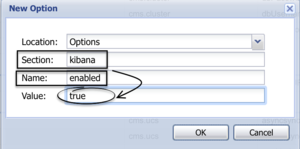
- From the Options tab in the kibana section, set the following option:
- option enabled to value true
- Click Save
By default, Kibana is enabled and Knowledge Center Server uses port 5601 to expose the Kibana application. As of version 9.0.002.09 you can configure a custom port for Kibana on the Knowledge Server node:
- Open Genesys Administrator and navigate to Provisioning > Environment > Applications.
- Select the application defined for the Knowledge Center Server node application and click Edit.
- Expand the Server Info pane.
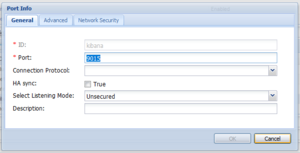
- In the Listening Ports section, select the port with the name "kibana" and click Edit. The Port Info dialog opens.
- Change the Port value and click OK.
- Save your changes.
As of version 9.0.004.x, to correctly import Kibana URLs into Pulse during Tenant Provisioning, you should create a port with the name "kibana" in the Genesys Knowledge Center Cluster application:
- Open Genesys Administrator and navigate to Provisioning > Environment > Applications.
- Select the application defined for the Knowledge Center Cluster application and click Edit.
- Expand the Server Info pane.
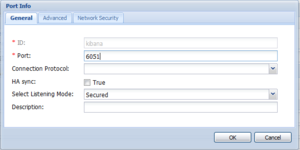
- In the Listening Ports section, create a port with name "Kibana" by clicking Add. The Port Info dialog opens.
- Enter the port number for the load-balancer configured for Kibana; for instance, 6051.
- If you are using a secure connection to Kibana Load-balancer, choose Secured under Select Listening Mode.
- Click OK. The HTTP or HTTPS port with the "Kibana" identifier appears in the list of Listening ports.
- Save your changes.
- The new configuration is applied to newly started nodes or restarted nodes.
- To ensure proper load balancing of requests between Kibana nodes embedded into Knowledge Center Servers you must configure the load balancer to distribute new sessions evenly between started nodes.
- Kibana load balancer must run on the same host as Knowledge Center Server load balancer.
- If Kibana Security proxy is configured, you cannot configure the "Kibana" port in the Knowledge Cluster Application. In this case, the "default" port will be used to access Kibana.
Kibana security
By default you can access the Reporting Dashboard in Kibana using the "kibana" port and host configured in the Knowledge Server Application. This behavior does expose the ability to modify and delete data via the DevTools console or Kibana API. To restrict the processing of any data modification requests, you need to enable the Kibana security proxy.
To enable restricted access to Kibana with proxy to protect the data from modification, follow these steps:
- Open Genesys Administrator and navigate to Provisioning > Environment > Applications.
- Select the application defined for the Knowledge Center Cluster and click Edit.
- From the Options tab in the kibana section, set the following options:
- Click Save.
ImportantAfter configuring the proxy you must restart all instances of Knowledge Center Server before doing any further activities against reporting.
If you want to close the access with proxy to Kibana which was already configured and provisioned, you must:
- Call tenant provisioning API.
- Remove all GK* widgets from Pulse (If they were already previously created) and create them again using updated GK* templates.
Configuring external Kibana
By default reporting is provided using the embedded Kibana version 6.2.3. You can install an external Kibana instance (https://www.elastic.co/kibana) and configure the Knowledge Server to show which dashboard is not embedded.
To enable reporting in external Kibana, follow these steps:
- Install and configure external Kibana (https://www.elastic.co/start).
- Open the Kibana configuration file (that is, kibana.yml), and add or change the following option: server.basePath: "/gks-server/kibana"
- Configure Kibana to use the same Elasticsearch used by the Genesys Knowledge Center.
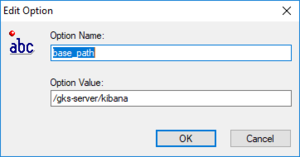
Access the Option of Knowledge Center Cluster application and set the following options in the Kibana section:
- base_path = /gks-server/kibana.
- host = set the external Kibana's hostname or IP address (for example - kibana.demo.com or 192.168.10.10).
- port = set the external Kibana's port (for example - 5601).
After you apply this configuration, run the Knowledge Server Cluster and the external Kibana.
Click the following link to access the Kibana: <GKC Server host or access>:<GKC server port>/gks-server/kibana/app/kibana.
- Access to the external Kibana will only be available via a secured proxy within the GKC Server. The secured proxy will redirect Kibana calls to a real external Kibana instance.
- If you use external Kibana - no need to configure Kibana port in GKC Server nodes applications or in GKC Cluster application. For external Kibana this port could be removed from configuration.
Pulse templates auto-provisioning
To configure Pulse templates auto-provisioning you must specify the pulse URL and credentials used during provisioning. From the host Knowledge Center Server installed:
- Locate the <installation_folder>/server folder:
Windows:- Open the launcher.ini configuration file
- Locate the following lines:
-Dreporting.pulse.url=http://host:port
-Dreporting.pulse.user=default
-Dreporting.pulse.password=password
Linux:
- Open setenv.sh file
- Locate line starting from CUSTOM_JAVA_OPTS and containing:
-Dreporting.pulse.url=http://host:port -Dreporting.pulse.user=default -Dreporting.pulse.password=password
- Change host:port to the actual host port of Pulse or its load balancer
- Change default to the user name you wish to use during provisioning
- Change the password to the password for this user account
- Save changes
- Restart Knowledge Center Node (Pulse should be running)
Troubleshooting
"No default index pattern" message
If you see "No default index pattern" message in Kibana you need to execute following steps:
- Stop Knowledge Center Server
- Delete the .kibana index in Elasticsearch by executing following command:
curl --request DELETE --url http://<ES Host>:<ES Port>/.kibana
- Start Knowledge Center Server
When the Knowledge Center Server re-initializes after start, the Kibana definitions help to resolve the problem.
"Error: EPERM: operation not permitted, open '.babelcache.json'" message
If you see message "Error: EPERM: operation not permitted, open '.babelcache.json'" in logs of the Knowledge Center Server you must execute following steps:
- Navigate to the <installation_folder>/server/kibana/optimize folder (the one the error message refers to)
- Using administrative permissions, delete file .babelcache.json
- Start Knowledge Center Server
Tenant Provisioning
Tenant Provisioning includes generation and importing visualization metadata into Pulse and Kibana. You can skip them with next application option under reporting section.
| Section | Option | Value | Description |
|---|---|---|---|
| reporting | kibana.provision | true or false | Enable or disable Kibana metadata provision. By default, is is set to true. |
| reporting | pulse.provision | true or false | Enable or disable widget templates import into Pulse. By default it is set to true. |
To perform a tenant provision, you need to execute a Reporting Provision API request:
For v.9.0.002.09
request POST
--url http://<Knowledge Cluster Host>:<Knowledge Cluster Port>/gks-server/reporting/v1/provision
--header 'content-type: application/json'
--header 'ContactCenterID: <Id of working Tenant>'
--data
'{
    "pulseUrl" : "http://<Pulse Host>:<Pulse Port>",
    "pulseUser": "<Pulse User>",
    "pulsePassword": "<Pulse User Password>",
    "kibanaTenantName": "<Custom name for working tenant>"
}'
For versions v.9.0.003 and higher
PulseUrl should be used in the format http://<Pulse Host>:<Pulse Port>/<Pulse base URL> this is because when using Pulse in GAX you use the URL format http://<Pulse Host>:<Pulse Port>/gax. Standalone Pulse however, by default, is configured in the URL as http://<Pulse Host>:<Pulse Port>/pulse.
Provisioning request for v.9.0.003 and higher should look like:
request POST
--url http://<Knowledge Cluster Host>:<Knowledge Cluster Port>/gks-server/reporting/v1/provision
--header 'content-type: application/json'
--header 'ContactCenterID: <Id of working Tenant>'
--data
'{
    "pulseUrl" : "http://<Pulse Host>:<Pulse Port>/<Pulse base URL>",
    "pulseUser": "<Pulse User>",
    "pulsePassword": "<Pulse User Password>",
    "kibanaTenantName": "<Custom name for working tenant>"
}'
When the provision is done correctly, you can expect the following response:
{ "status": {
        "code": 200,
        "message": "Ok" },
    "data": {
        "provisionLog": {
            "log": [
                "Kibana Provision - DONE",
                "Pulse Provision - DONE"]
} } }
Example (v9.0.002.09)
curl --request POST \
--url http://localhost:9010/gks-server/reporting/v1/provision \
--header 'content-type: application/json' \
--header 'ContactCenterID: a906b47e-e641-4216-96e5-05c827725ecd' \
--data '{
    "pulseUrl" : "http://demosrv:8081",
    "pulseUser": "default",
    "pulsePassword": "password",
    "kibanaTenantName": "Genesys Tenant"
}'
Example (v9.0.003 and higher)
curl --request POST
--url http://localhost:9010/gks-server/reporting/v1/provision
--header 'content-type: application/json'
--header 'ContactCenterID: a906b47e-e641-4216-96e5-05c827725ecd'
--data '{
    "pulseUrl" : "http://demosrv:8081/pulse",
    "pulseUser": "default",
    "pulsePassword": "password",
    "kibanaTenantName": "Genesys Tenant"
}'
Adding Knowledge Widgets in Pulse
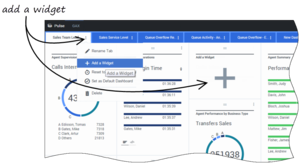
- There are two ways you can add a report to your dashboard or wallboard:
- Click the more icon (
 ) in the right corner and click Add a Widget.
 - On empty dashboards and wallboards, click the Add a Widget icon.
To quickly locate Knowledge Center widgets in the search bar of the "Add a Widget" window, type "GK" and it will filter Knowledge Center widgets:
Important- If widgets are not shown, it means that they have not yet been provisioned
- In versions of 9.0.001.xx family Knowledge Center provisions widget templates automatically as soon as:
- kibana/enabled options are set to true
- reporting.pulse.* variables are properly set
- Knowledge Center Server node with proper settings is re-started
- Please investigate log files for errors if you do not see provisioned Pulse templates after these steps are completed
- Click the more icon (
- Select one of the widgets:
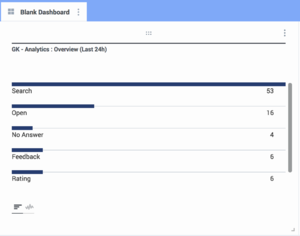
- GK - Analytics: Overview (Last 24h) - provides summary statistics on knowledge usage events (such as search requests, feedback, 5-star rating, comments, and other) over last 24 hours. Expanded view for this widget displays the Kibana dashboard allowing you to discover details of knowledge events.
- GK - Knowledge Objects Summary - provides you a summary of indexed knowledge (number of knowledge bases, documents, categories, and others), Expanded view for this widget displays the Kibana dashboard allowing you to explore indexed knowledge documents.
- GK - Performance: Processing Time (Last 24h) - provides you request processing performance metrics allowing you to monitor solution performance. Expanded view for this widget displays the Kibana dashboard with detailed performance information.
- Click the Create Widget button
- Select the Objects and Statistics that you want to use in your report
- Click the Display Options tab to define how you want to display your report, such as:
- Widget Title
- Widget Type
- Size
- Headline Type & Object
- Click Create Widget and the newly added widget will appear on the dashboard:

