Contents
Summary
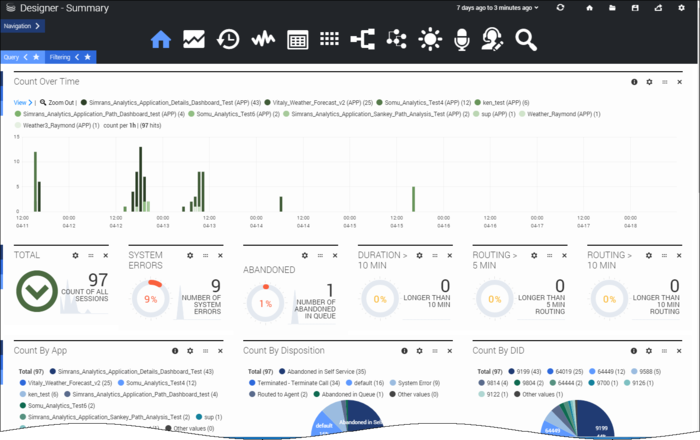
The Summary dashboard gives you a quick overview of what's happening with your application sessions.
You can use the information provided here to see if there are any patterns that can give you insight into the sessions being initiated on Designer. For example, you might look at sessions over a period of time (such as the last 24 hours, a week, or a month) to see how sessions are being handled across various applications, what's happening to those sessions, and how much time callers are spending in various stages of applications.
Reports on this dashboard
Count Over Time
This report shows you the patterns of traffic that are coming onto the platform over a period of time. You can quickly adjust the range of time shown, say, for the last hour, 24 hours, or the last week, to see how sessions are being initiated on the platform.
Each bar indicates the total number of sessions for each application that took place during the given time period. The higher the bar, the more sessions that ran. You can easily see what time of the day (or what day of the week) that traffic is higher or lower, and organize your business accordingly.
Total
The total number of sessions or interactions that were processed.
System Errors
The percentage of sessions (out of all sessions) that had system errors. (A system error does not necessarily mean that your callers experienced any issues with the applications. This report helps you to notice any possible issues with the system platform.)
Abandoned
The percentage of sessions that are being abandoned while callers are in the Assisted Service (or routing) phase. A higher number might indicate that callers are waiting too long and hanging up before they can be connected to an agent.
Duration > 10 Mins
The percentage of sessions where a caller spent more than 10 minutes combined in both the Self-Service and Assisted Service phases. This gives you an overall look at how long it's taking for callers to be processed.
Routing > 5/10 Mins
The percentage of sessions where a caller spent more than 5/10 minutes in the routing (or Assisted Service) phase. This lets you see if there are any potential issues that might be causing callers to be stuck in the routing phase for too long.
Count by Apps
This report provides distributions of sessions across the various applications that were built on Designer. This data could be useful in allocating resources based on the traffic across applications.
Count by Disposition
This report provides distributions of sessions across the various disposition codes. A disposition represents the status of a call at the time it exited the call flow, such as whether it was routed to an agent or the caller hung up.
This data could be useful in finding out how your application sessions are actually performing. For example, if a high amount of sessions are getting abandoned in Self Service, you can check if there is an application error or some other reason why those calls aren't getting sent to agents.

