Data Tables
The Data Tables dashboard arranges the disposition data of your applications in a tabular format.
Reports on this dashboard
Count Over Time
(See the Summary dashboard page for a description of this report.)
Filter
(See the Application Details dashboard page for a description of this panel.)
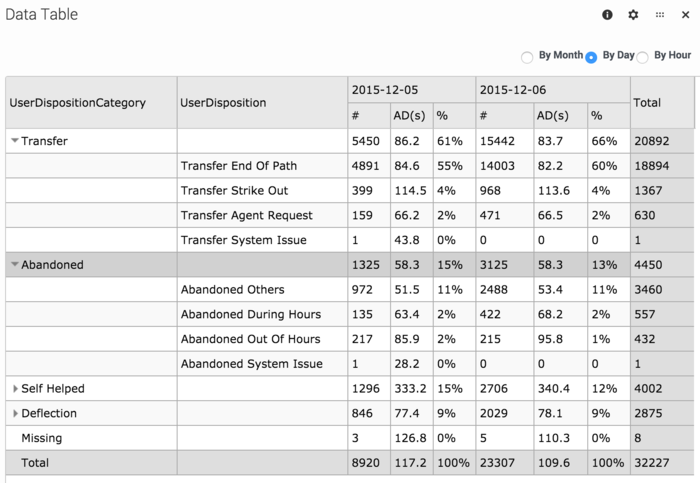
Data Table
This report organizes the application disposition information into a table view. It groups the dispositions by category so you can see:
- the number of sessions that took place (#)
- the average duration (in seconds) for each session (AD)
- the percentage count of sessions (%)
You can then use the options to toggle the results By Month, By Day, or By Hour to get a more detailed look at the final results of your calls.
Important
By Hour is only available if the given time window is within two days. This page was last edited on June 26, 2018, at 20:51.
Comments or questions about this documentation? Contact us for support!

