Sunburst Path Analysis
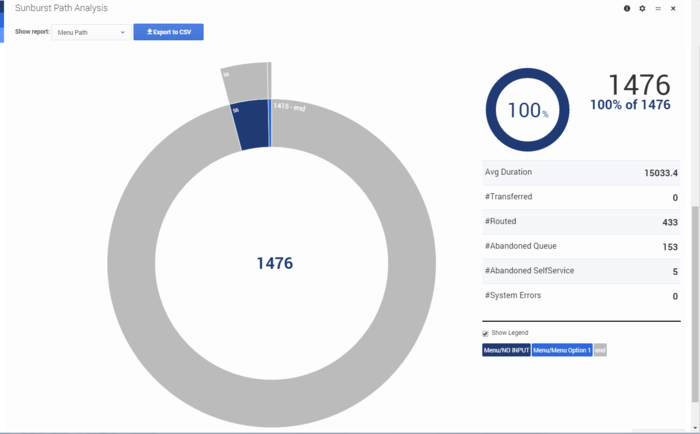
The Sunburst Path Analysis dashboard shows a visual representation of the menu and milestone paths for your application sessions.
Reports on this dashboard
Count Over Time
(See Count Over Time.)
Filter
(See Filter.)
Sunburst Path Analysis
By default, this report displays the first seven nodes of a menu or milestones path, but you can change this in the configuration settings for the panel. The center of circle shows the total count, and you can double-click any of the partitions to drill down for more information.
This page was last edited on December 19, 2019, at 17:47.
Comments or questions about this documentation? Contact us for support!

