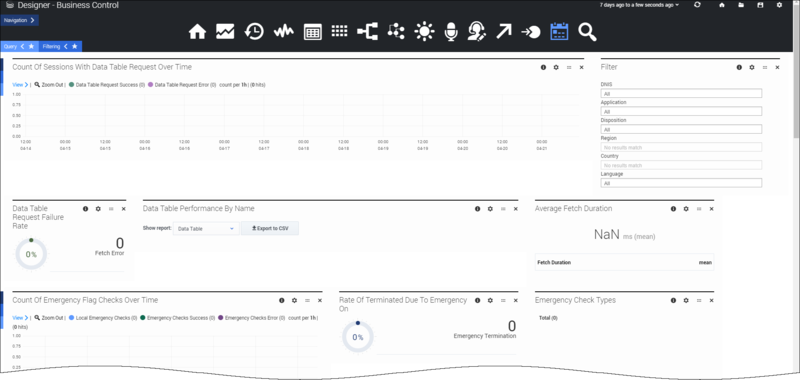
Business Control Dashboard
The Business Control dashboard provides near real-time metrics on the runtime usage of Emergency Flags, Business Hours, Special Days, and Data Tables.
Reports on this dashboard
Filter
(See the Application Details dashboard page for a description of this panel.)
Data Tables
Count of Sessions With Data Table Request Over Time
This report shows you the number of data table retrieval requests that were received over a period of time. You can quickly adjust the range of time shown, say, for the last hour, 24 hours, or the last week, to see the trends for those specific time periods.
Each bar indicates the total number of data table retrieval requests for each application that took place during the given time period. The higher the bar, the higher the number of requests. You can easily see what time of the day (or what day of the week) that requests are higher or lower, and organize your business accordingly.
Data Table Request Failure Rate
The failure rate (as a percentage) of data table requests across all sessions. It also shows the total number of Fetch Errors.
Data Table Performance by Name
A breakdown of outcomes for the most requested data tables. You can export the results to a CSV file.
Data Table Request Fetch Duration
The average duration (ms) of data table fetch requests, grouped by outcome (success or failure).
Emergency Flags
Count of Emergency Flag Checks Over Time
The total number of Emergency Flag checks that were sent during the selected period of time.
Rate of Terminated Due to Emergency On
The total rates of sessions (where an emergency flag was checked) that were terminated due to the Emergency flag being on.
Emergency Check Types
A breakdown of Emergency checks by type.
Emergency Check Error Rate
The rate of errors (as a percentage) across all external emergency checks. It also shows the total of Check Errors.
A breakdown of outcomes for the most checked Emergency flags. You can export the results to a CSV file.
External Emergency Check Fetch Duration
The average duration (ms) of Emergency check fetch requests, grouped by outcome (success or failure).
Business Hours
Count of Business Hours Checks Over Time
The total number of Business Hours checks that were sent during the selected period of time.
Rate of Terminated Due to Business Closed
The total rates of sessions (where Business Hours were checked) that were terminated due to the business being closed.
Business Hours Check Types
A breakdown of Business Hours checks by type.
Business Hours Check Error Rate
The rate of errors (as a percentage) across all external Business Hours checks. It also shows the total of Check Errors.
A breakdown of outcomes for the most checked Business Hours. You can export the results to a CSV file.
Business Hours Check Fetch Duration
The average duration (ms) of Business Hours check fetch requests, grouped by outcome (success or failure).
Special Days
Count of Special Days Checks Over Time
The total number of Special Days checks that were sent during the selected period of time.
Rate of Terminated Due to Special Days
The rate of sessions (where Special Days were checked) that were terminated due to it being a Special Day.
Special Days Hours Check Error Rate
The rate of errors (as a percentage) across all external Special Days checks. It also shows the total of Check Errors.
Special Days Check Type Breakdown
A breakdown of Special Days checks by type.
A breakdown of outcomes for the most checked Special Days. You can export the results to a CSV file.
Special Days Check Fetch Duration
The average duration (ms) of Special Days check fetch requests, grouped by outcome (success or failure).
Top Hit Holidays
A list of the top holidays where a Special Days check returned true.
Errors
Count of Sessions With Business Control Errors Over Time
The total counts of sessions where errors in Data Table, (shared) Emergency Flag, (shared) Special Days and (shared) Business Hours checks were encountered, over the selected period of time.

