Contents
Dashboard management
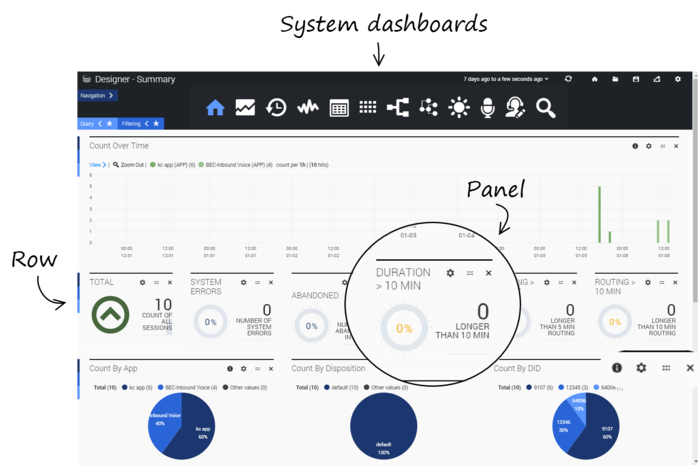
Each dashboard is made up of several rows, each containing one or more reporting panels. The buttons on the main dashboard toolbar let you quickly navigate between the various types of system dashboards.
The settings for the built-in system dashboards cannot be changed.
Rows and Panels
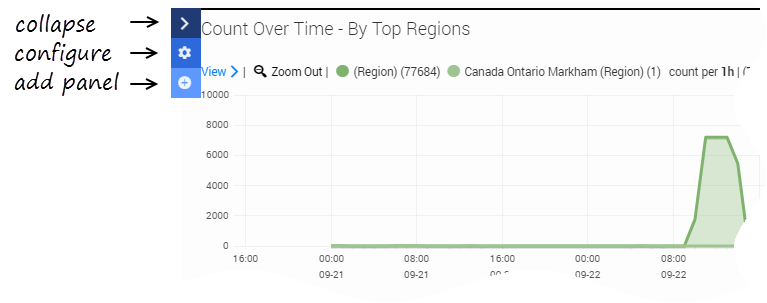
On the left side of each row is a sliding menu that remains hidden (or collapsed) when not in use. The menu slides out when you hover over it and has options to collapse, configure, or add panels to the row.
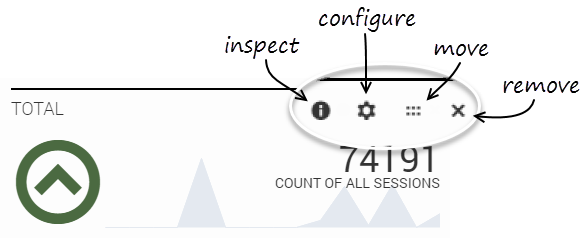
Each of the panels has options to configure, move, or remove the panel. Some panels also have an inspect icon that lets you view the query for the report being displayed.
Dashboard controls
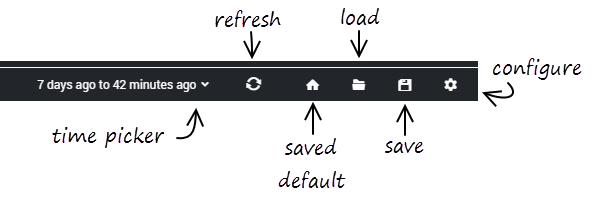
At the top of the screen are control icons for performing common tasks.
Time picker
Lets you select the time period for which you want to display data.
Refresh
Refreshes the dashboard with the most current data for the selected time period.
Home (saved default)
Returns to the dashboard that is currently saved as the default (or "home") dashboard.
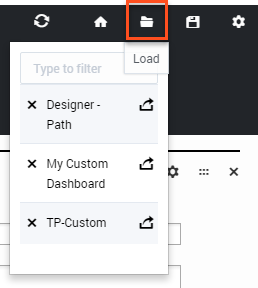
Load
Lets you select and open any dashboards that you have saved.
Save
Saves the current dashboard. You will be prompted to give the dashboard a new name. (This option might not be available for all users or deployments.)
Configure
Customize certain properties and settings for the current dashboard.
Toggling these tabs lets you show or hide their options.
Shows or hides the dashboard icons.
Query tab
Toggling the Query tab lets you manually enter a query statement to search for specific terms, criteria, or conditions.
For example, you might enter the following query:
=applicationName=Test 2 AND finalDisposition=System Error AND ANI=703-123-1234
This query would search the Test 2 application for sessions where the final disposition was System Error and the ANI (the caller's phone number) was 703-123-1234.
Query statements are not automatically applied to all panels on the dashboard. To use a query statement on a panel, go to the panel's Configure settings and select it from the Queries tab.
Filtering tab
Toggling the Filtering tab lets you see any filters that are currently applied to the dashboards.
Whenever you select a value from the Filter panel, or click a specific time range or section of a pie or bar chart, a filter is automatically created. In this example, we can see that an Abandoned in Self Service filter was applied:
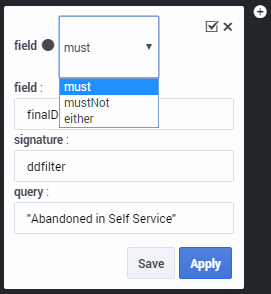
With the filters visible, you can easily modify, remove, or turn a filter on or off (the solid dot indicates the filter is currently on).
You can also make a filter inclusive or exclusive by clicking the field and choosing one of the options:

