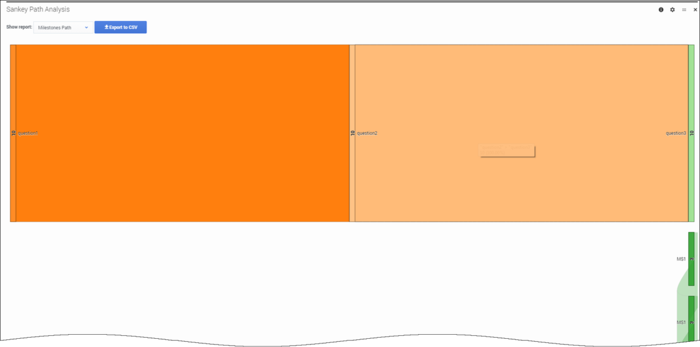
Sankey Path Analysis
This dashboard is similar to the Path dashboard, except that it generates the results based on milestones and menu inputs.
Tip
The Sankey panel might not be able to render correctly if there are several nodes or links to display. When this happens, you'll be prompted to increase the height of the panel.Reports on this dashboard
Count Over Time
(See Count Over Time.)
Filter
(See Filter.)
Sankey Path Analysis
This diagram shows how sessions are tracking through a series of milestones or menu inputs. You can toggle between the different reports using the Show report menu, and export the results to a CSV file.
This page was last edited on December 19, 2019, at 17:47.
Comments or questions about this documentation? Contact us for support!

