Analyzing Dataset Trends and Details
The Dataset page enables you to explore your datasets and perform analyses on them.
You can also run an analysis to create a Feature Analysis report, an Agent Variance report, or a Lift Estimation report. These reports show a series of charts and graphs, enabling even more nuanced ways of parsing and understanding your data. You can break down the view to show subsets of the data. After running an analysis, you can view a report of the results and compare reports with different input selected.
Tip
The Datasets tab might load and respond slowly if you are viewing a dataset with a large number of visible columns. To improve performance, go to the Schema > Datasets tab in the Settings window and configure the Visibility radio button to leave no more than about 20 fields visible.View dataset trends
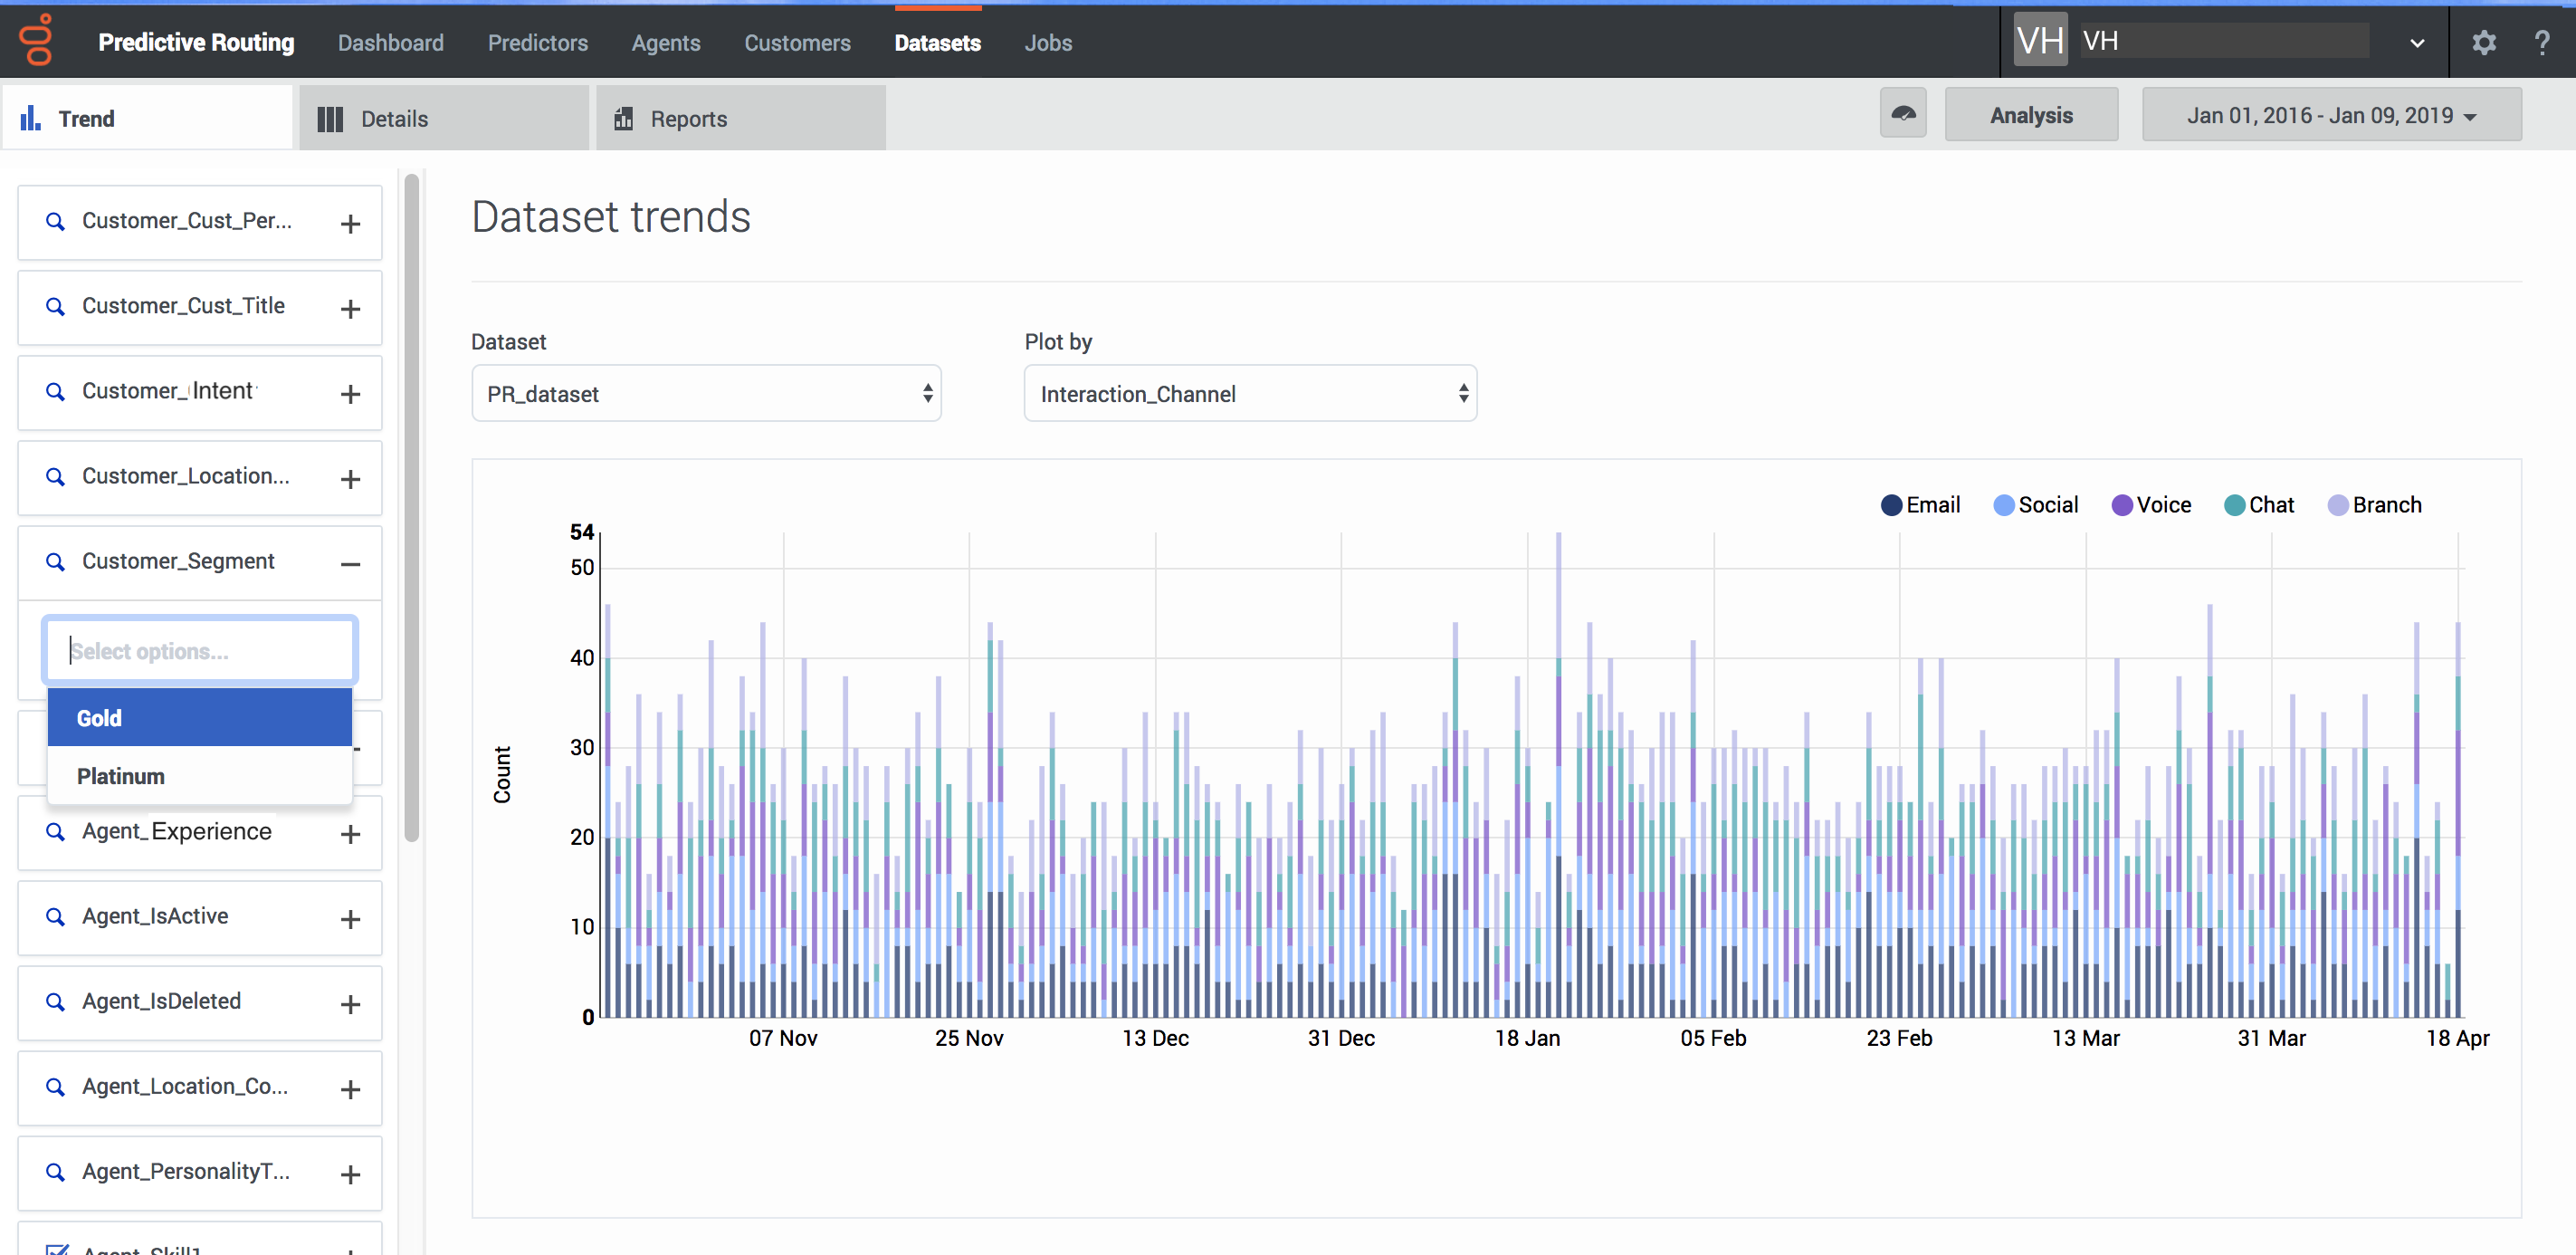
To view dataset trends, do the following steps:
- Select Dataset from the top navigation.
- Click the Trends tab.
- From the left-hand navigation, select the parameters you want to include. To choose specific facets:
- Click the + sign by the facet you want to drill down into.
- Click in the text box that appears.
- Select the parameters from the drop-down list.
- To change which dataset you are viewing, select the desired dataset from the Dataset drop-down list.
- To change the graph axis, select the desired facet from the Plot by drop-down list.
View dataset details
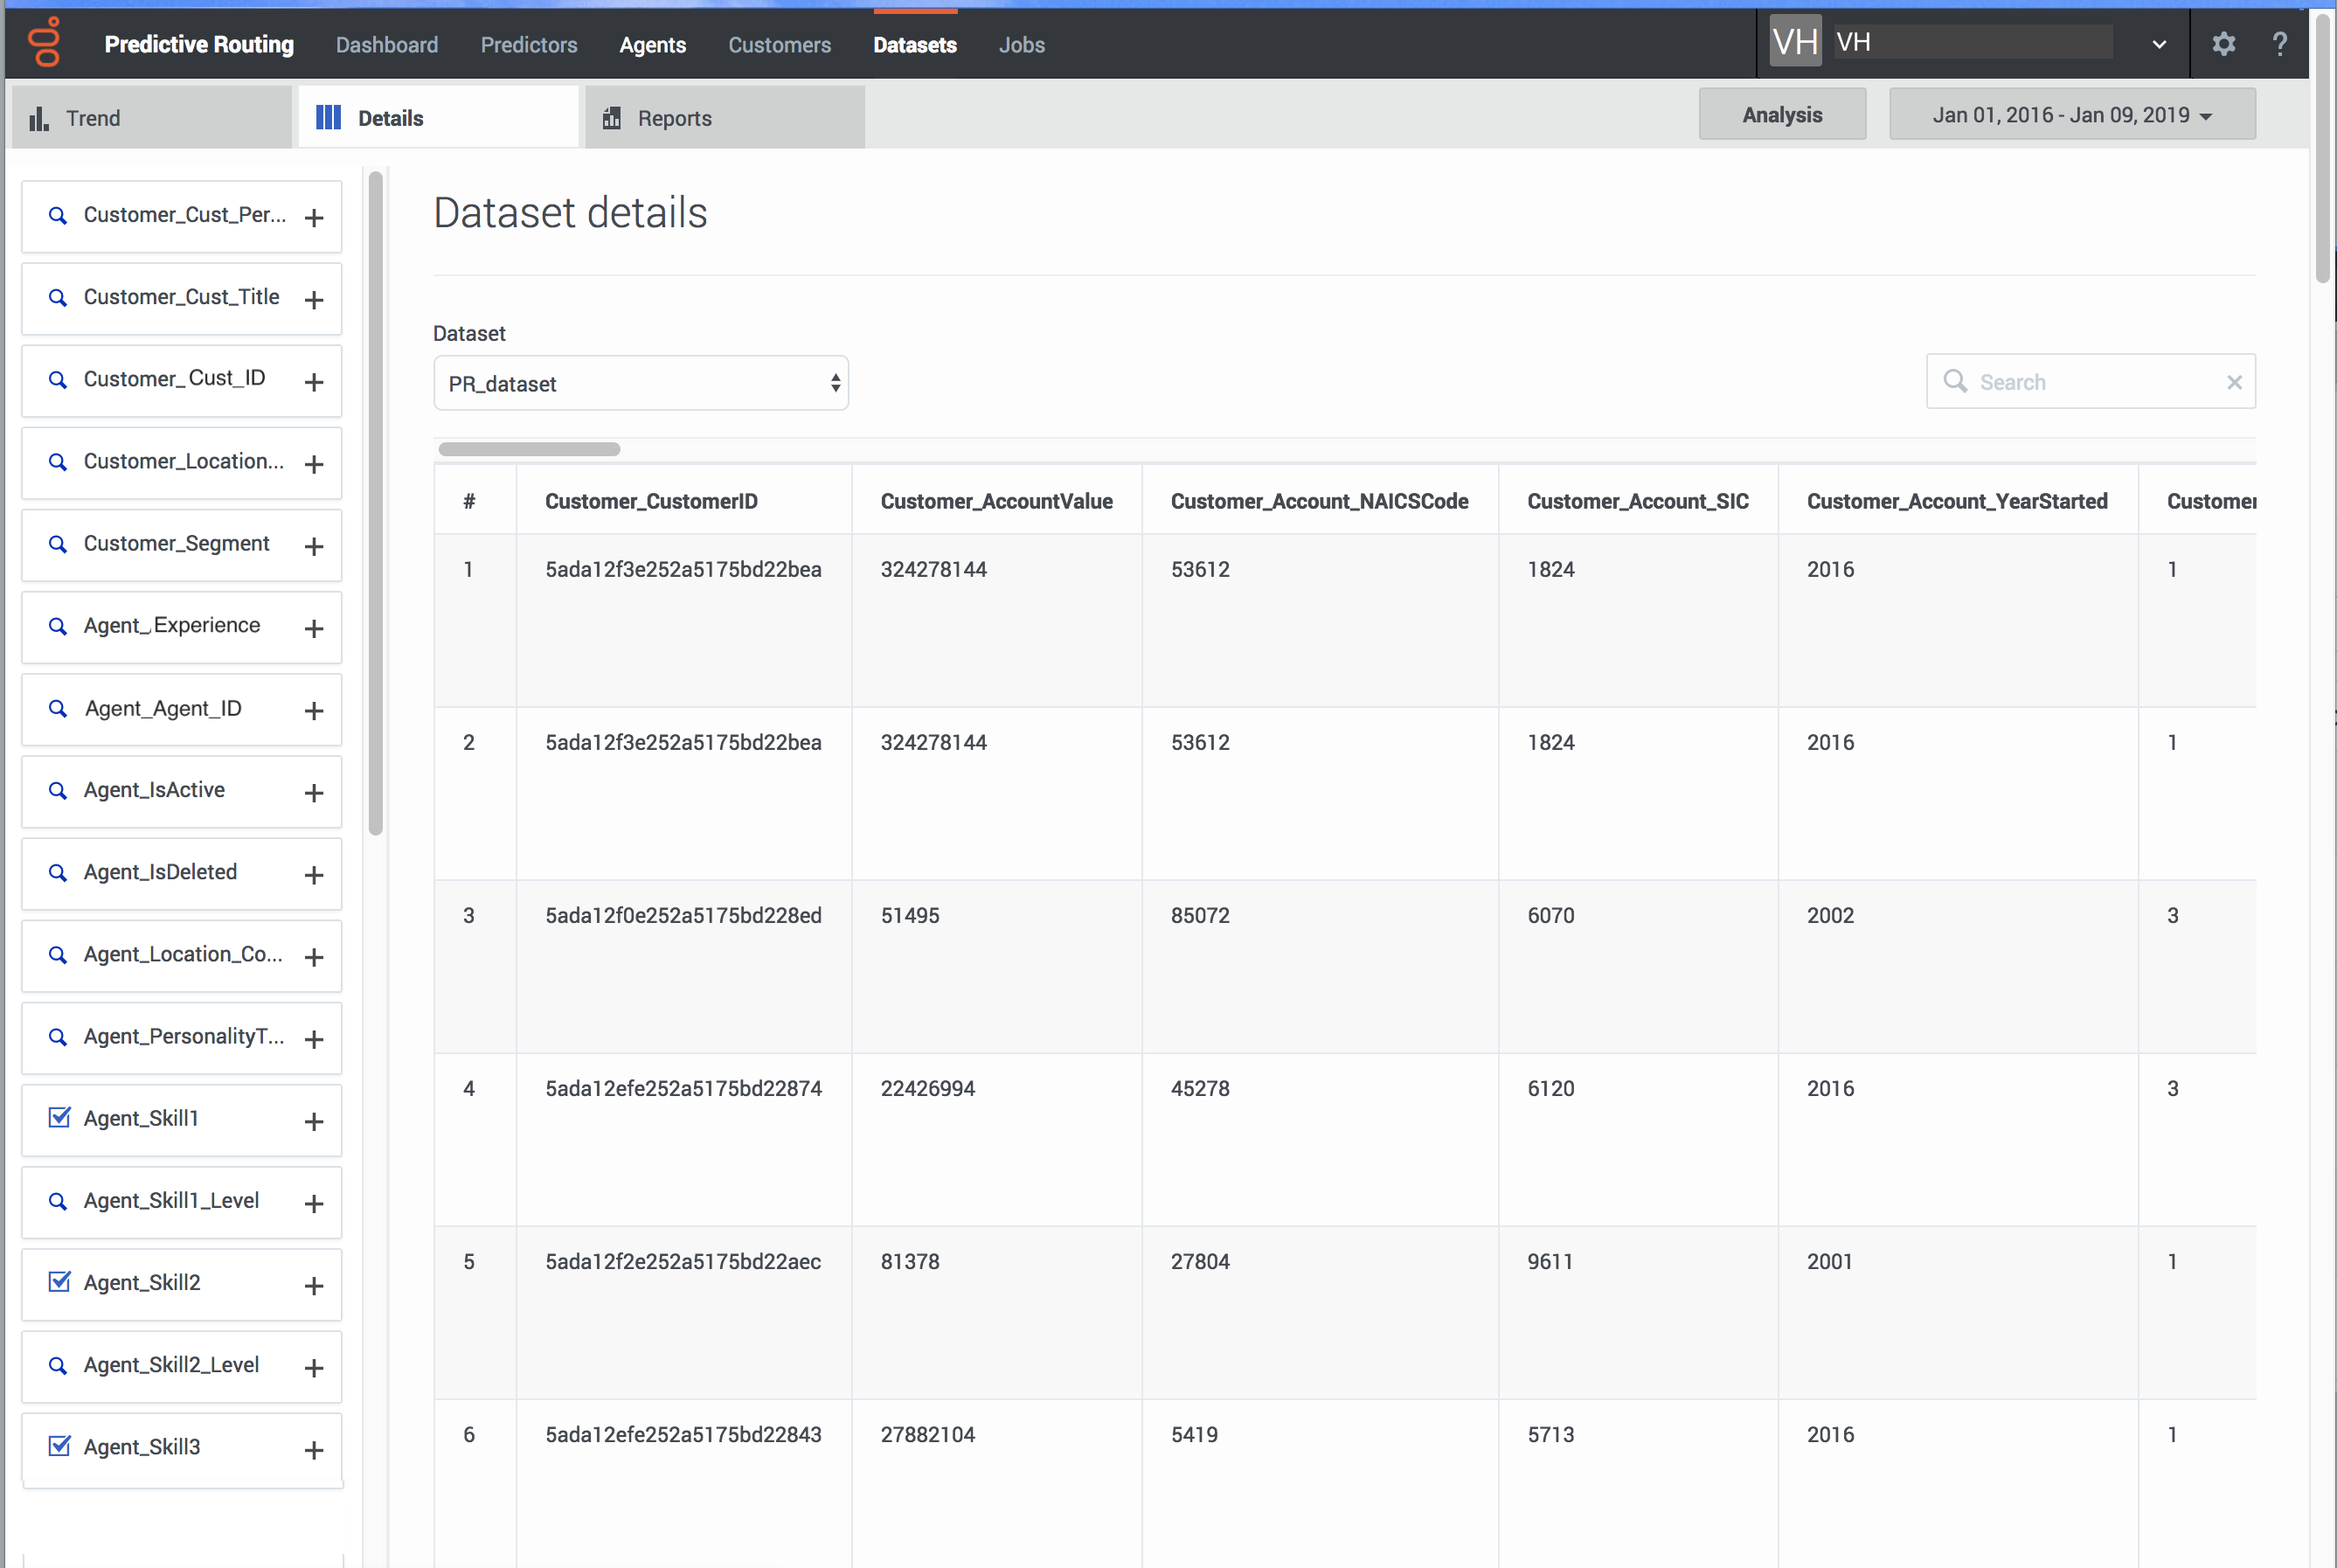
The dataset Details tab enables you to drill down into your dataset to view the granular specifics of your data.
Important
If you have many columns in your dataset, some might not be visible in the interface. To view all columns for a row, click that row to open a window containing the complete record. It appears as a two-column table. The first column contains the names of all properties and the second column contains the corresponding values.- Select Dataset from the top navigation.
- Click the Details tab.
- From the left-hand navigation, select the parameters you want to include. To choose specific facets:
- Click the + sign by the facet you want to drill down into.
- Click in the text box that appears.
- Select the parameters from the drop-down list.
- To change which dataset you are viewing, select the desired dataset from the Dataset drop-down list.
This page was last edited on March 5, 2018, at 21:24.
Comments or questions about this documentation? Contact us for support!


