Contents
Analyzing Predictors
The Predictors tab enables you view predictor Trends, Distribution, and Details. You can drill-down and adjust the features shown in the graph to analyze the impacts of each factor on the data as a whole.
You can also run an analysis to create a Feature Analysis report, an Agent Variance report, or a Lift Estimation report. These reports shows a series of charts and graphs, enabling even more nuanced ways of parsing and understanding your data. You can break down the view to show subsets of the data. After running an analysis, you can view a report of the results and compare reports with different input selected.
- To open the Predictors tab, click Predictors on the top navigation bar.
You can create reports showing model performance versus actual data to see which factors have an impact on performance. For example, you could determine how important it is that an agent be a native-level speaker of the customer's language, and then route interactions accordingly.
- For instructions on how to run an analysis of model quality, see ROC model quality analysis.
View predictor trends
To view predictor trends:
- Select Predictors from the top navigation.
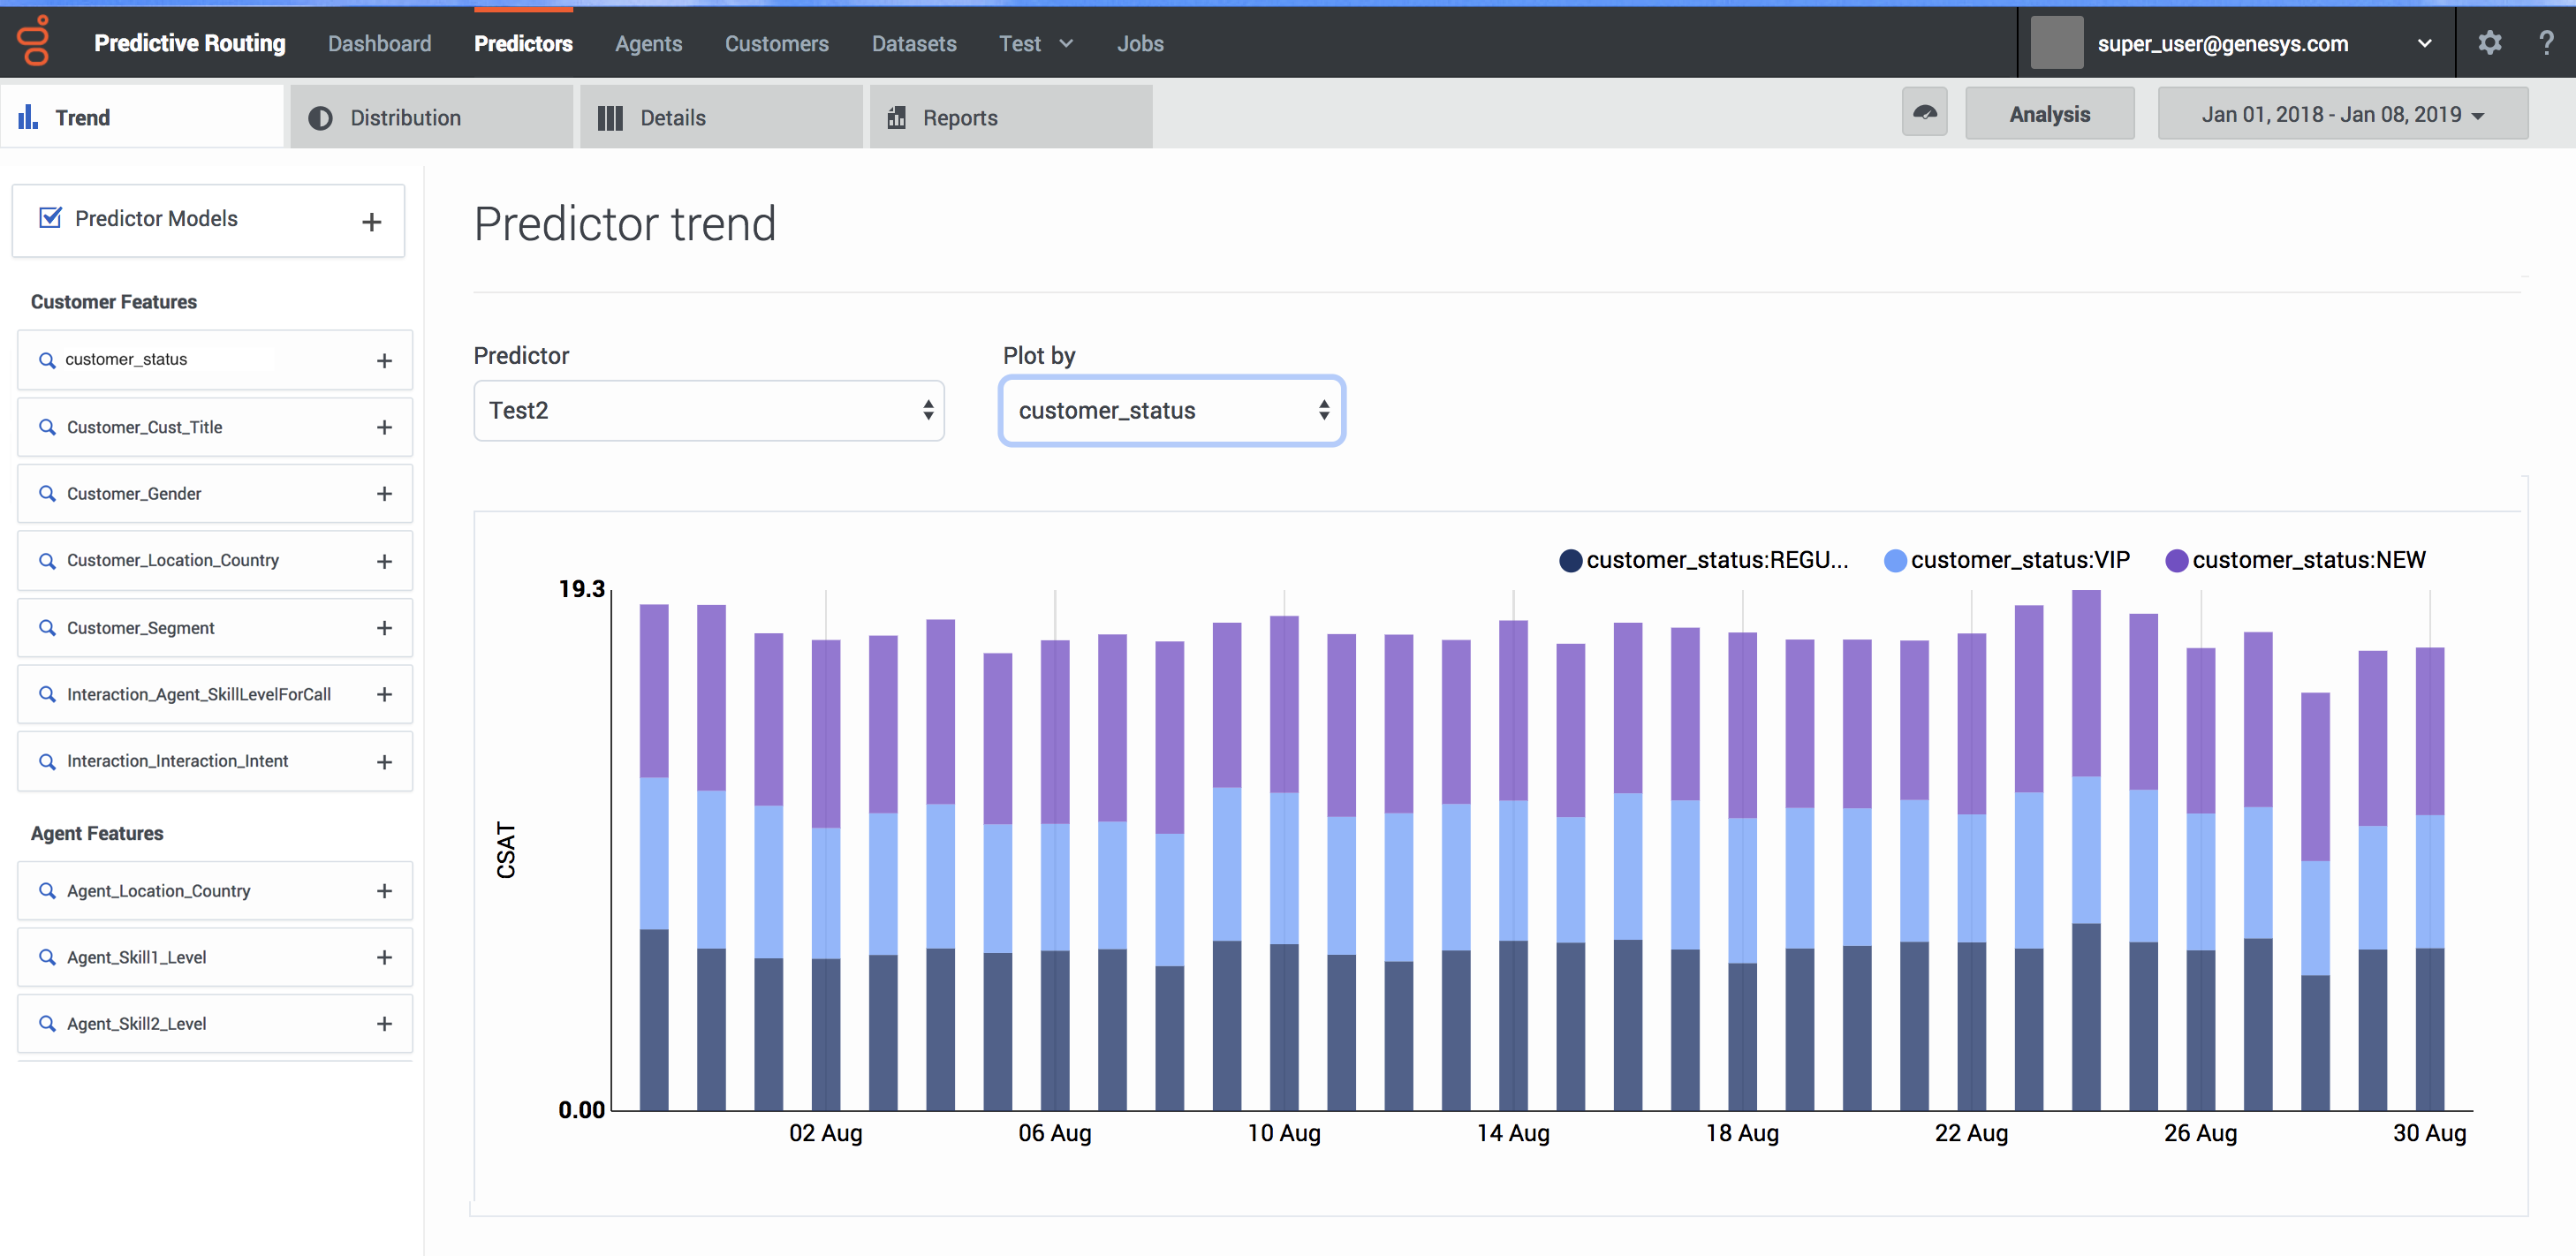
- Click the Trends tab.
- From the left-hand navigation, select the parameters you want to include. To choose specific facets:
- Click the + sign by the facet you want to drill down into.
- Click in the text box that appears.
- Select the parameters from the drop-down list.
- To change which predictor you are viewing, select the desired predictor from the Predictor drop-down list.
- To change the graph axis, select the desired facet from the Plot by drop down list.
View predictor distribution
To view the way that specific types of data occur in your predictor:
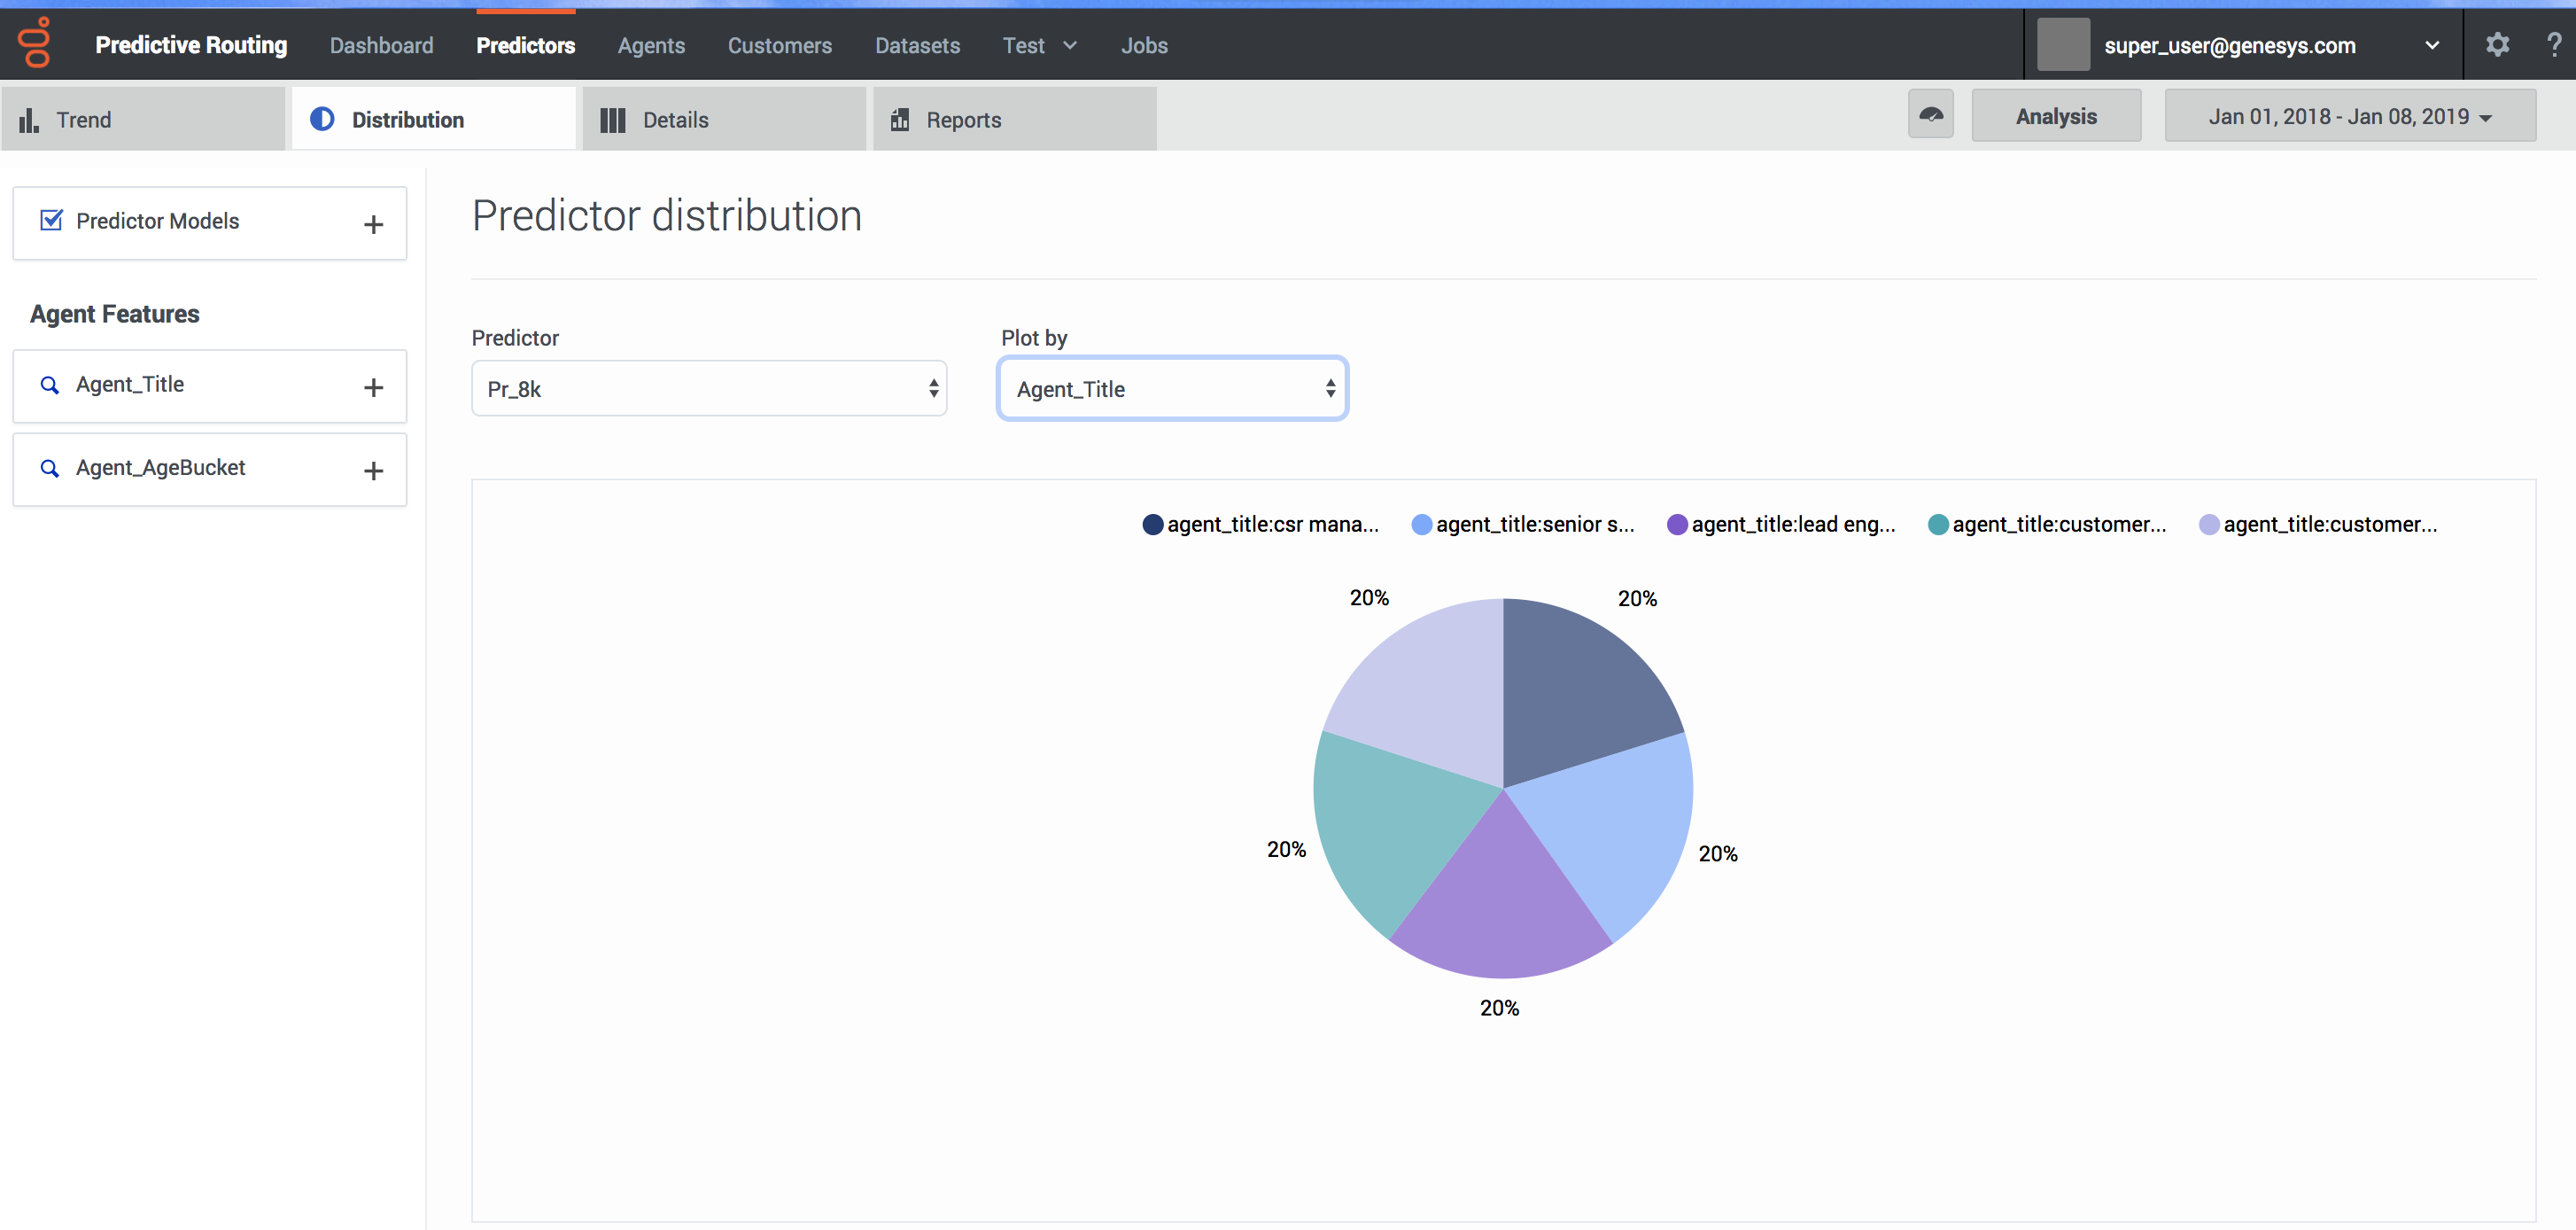
- Click the Distribution tab.
- From the left-hand navigation, select the parameters you want to include. To choose specific facets:
- Click the + sign by the facet you want to drill down into.
- Click in the text box that appears.
- Select the parameters from the drop-down list.
- To change which predictor you are viewing, select the desired predictor from the Predictor drop-down list.
- To change the graph axis, select the desired facet from the Plot by drop down list.
View predictor details
The predictor Details tab enables you to drill down into your predictor to view the granular specifics of your data.
- Select Predictors from the top navigation.
- Click the Details tab.
- From the left-hand navigation, select the parameters you want to include. To choose specific facets:
- Click the + sign by the facet you want to drill down into.
- Click in the text box that appears.
- Select the parameters from the drop-down list.
- To change which predictor you are viewing, select the desired predictor from the Predictor drop-down list.


