Analyzing Agent Details
To view information about the agents who appear in your environment, use the Agents page.
- To open it, click Agents on the top navigation bar.
Important
- If you have many columns in your Agent Profile schema, some might not be visible in the interface. To view all columns for a row, click that row to open a window containing the complete record. It appears as a two-column table. The first column contains the names of all properties and the second column contains the corresponding values.
- Fields with the visibility turned off in the Agent Profile schema are not visible on the Agent Details tab.
View agent distribution
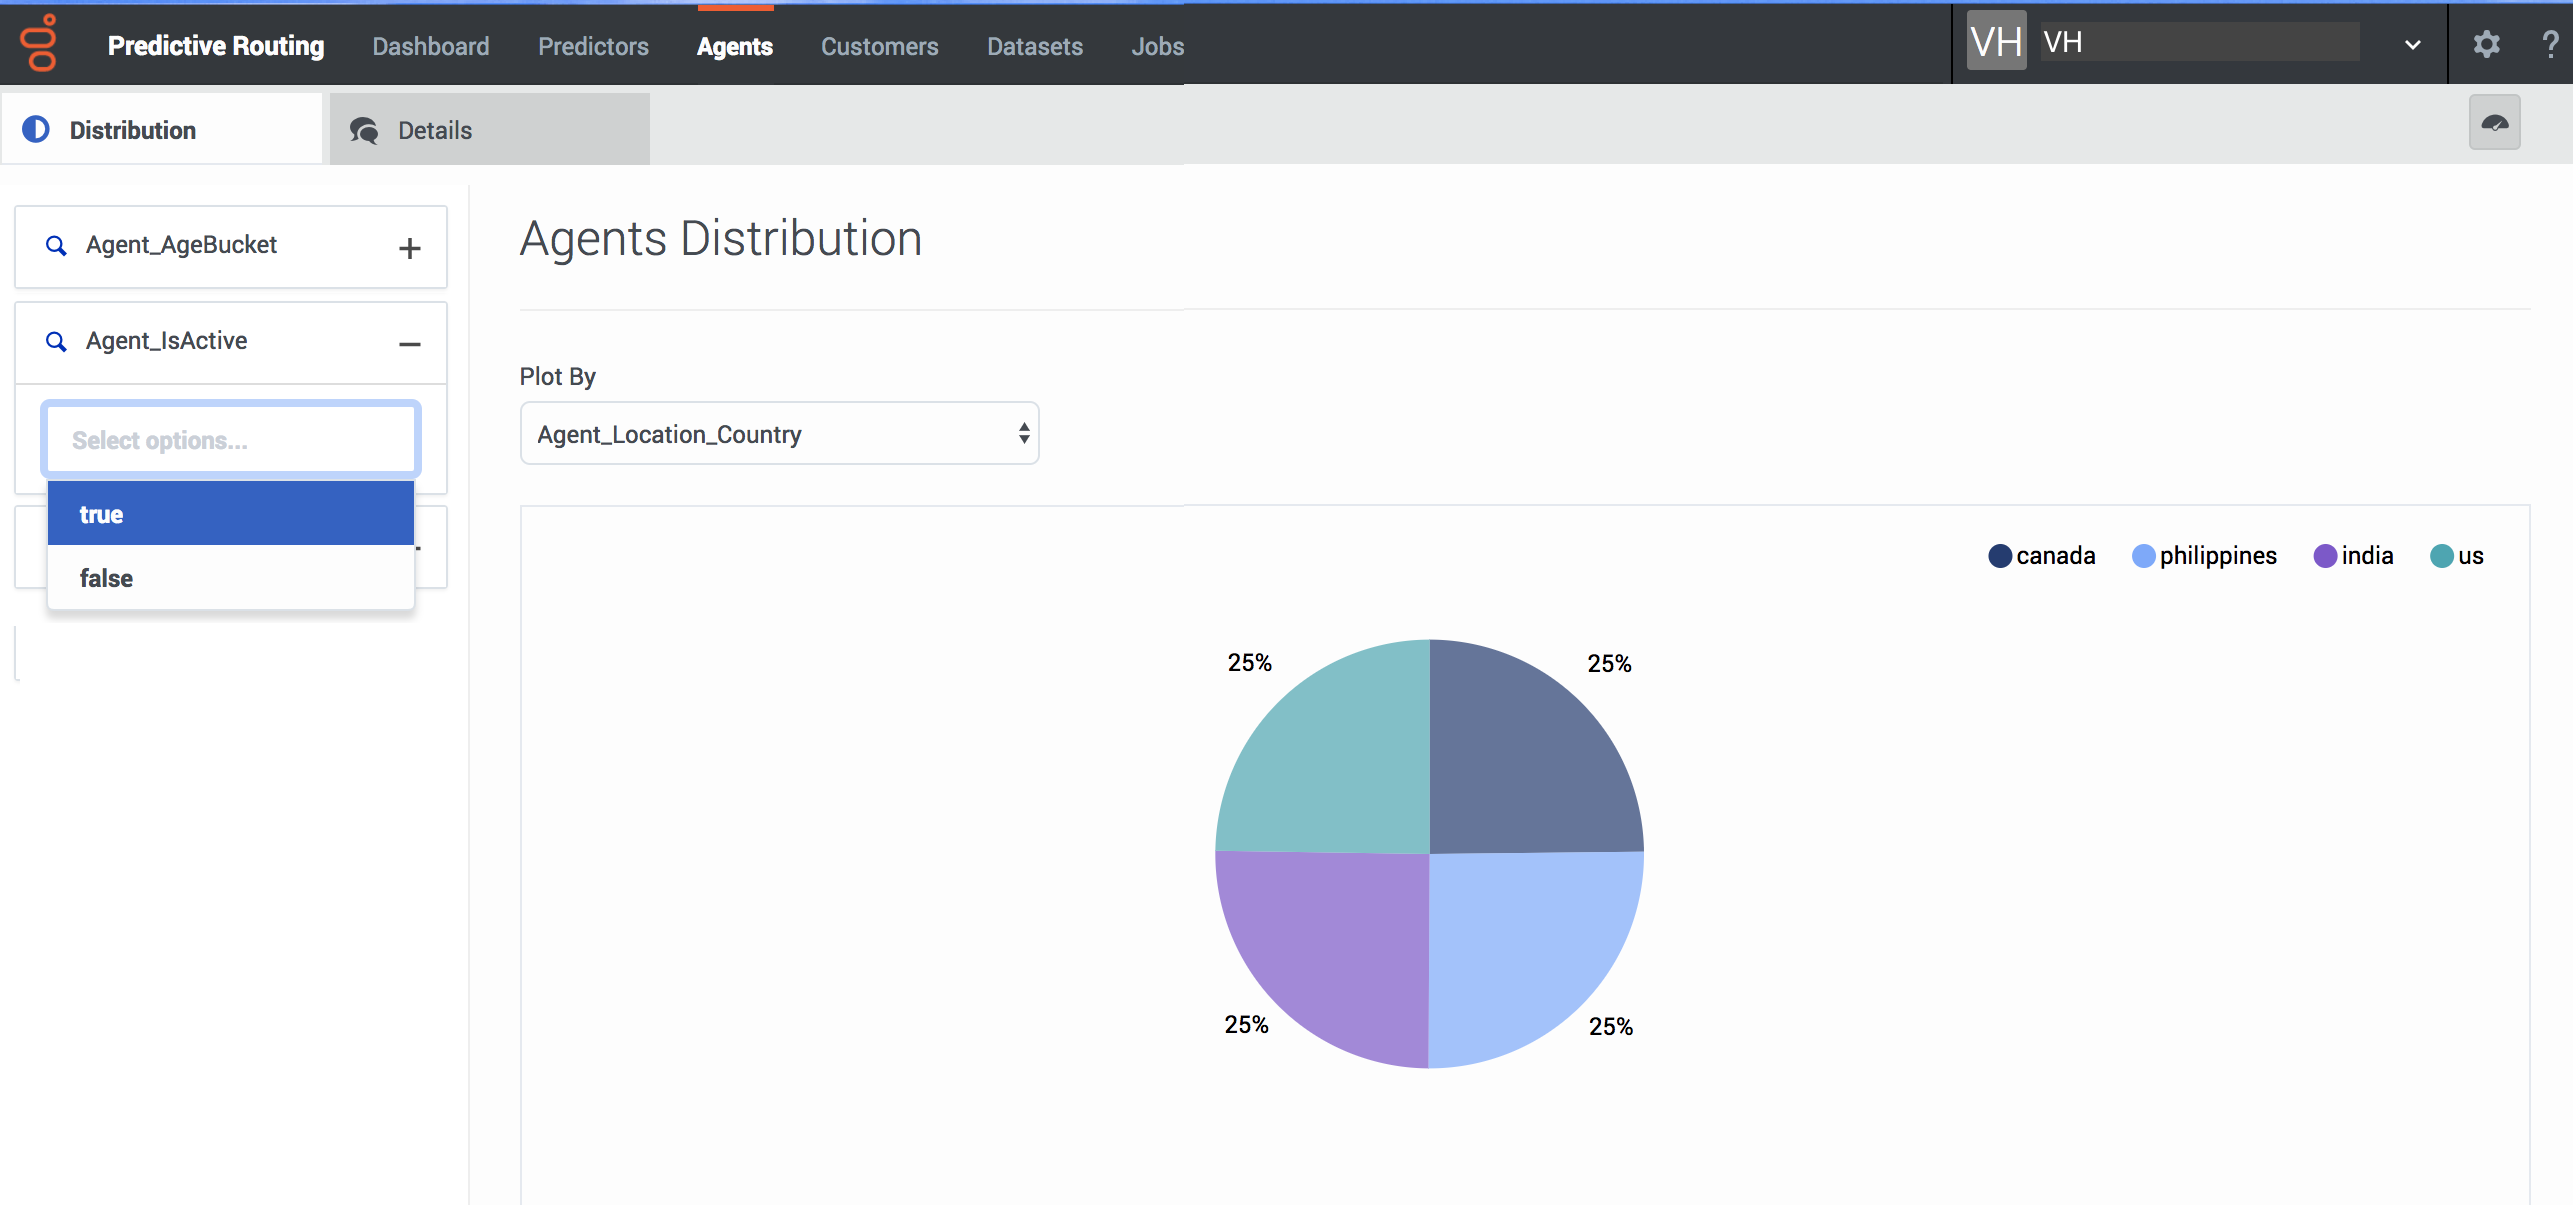
The Distribution tab enables you to parse your agent-related data, which is shown in the form of a pie graph. To change the parameters taken into account:
- Use the Plot by drop-down menu.
- Choose from the various filters on the left side of the page. To make selections, click the + sign by a factor, then click in the text box that appears, which opens a drop-down menu of options.
- To change the date, use the date selector at the right side of the blue top navigation bar.
View agent details
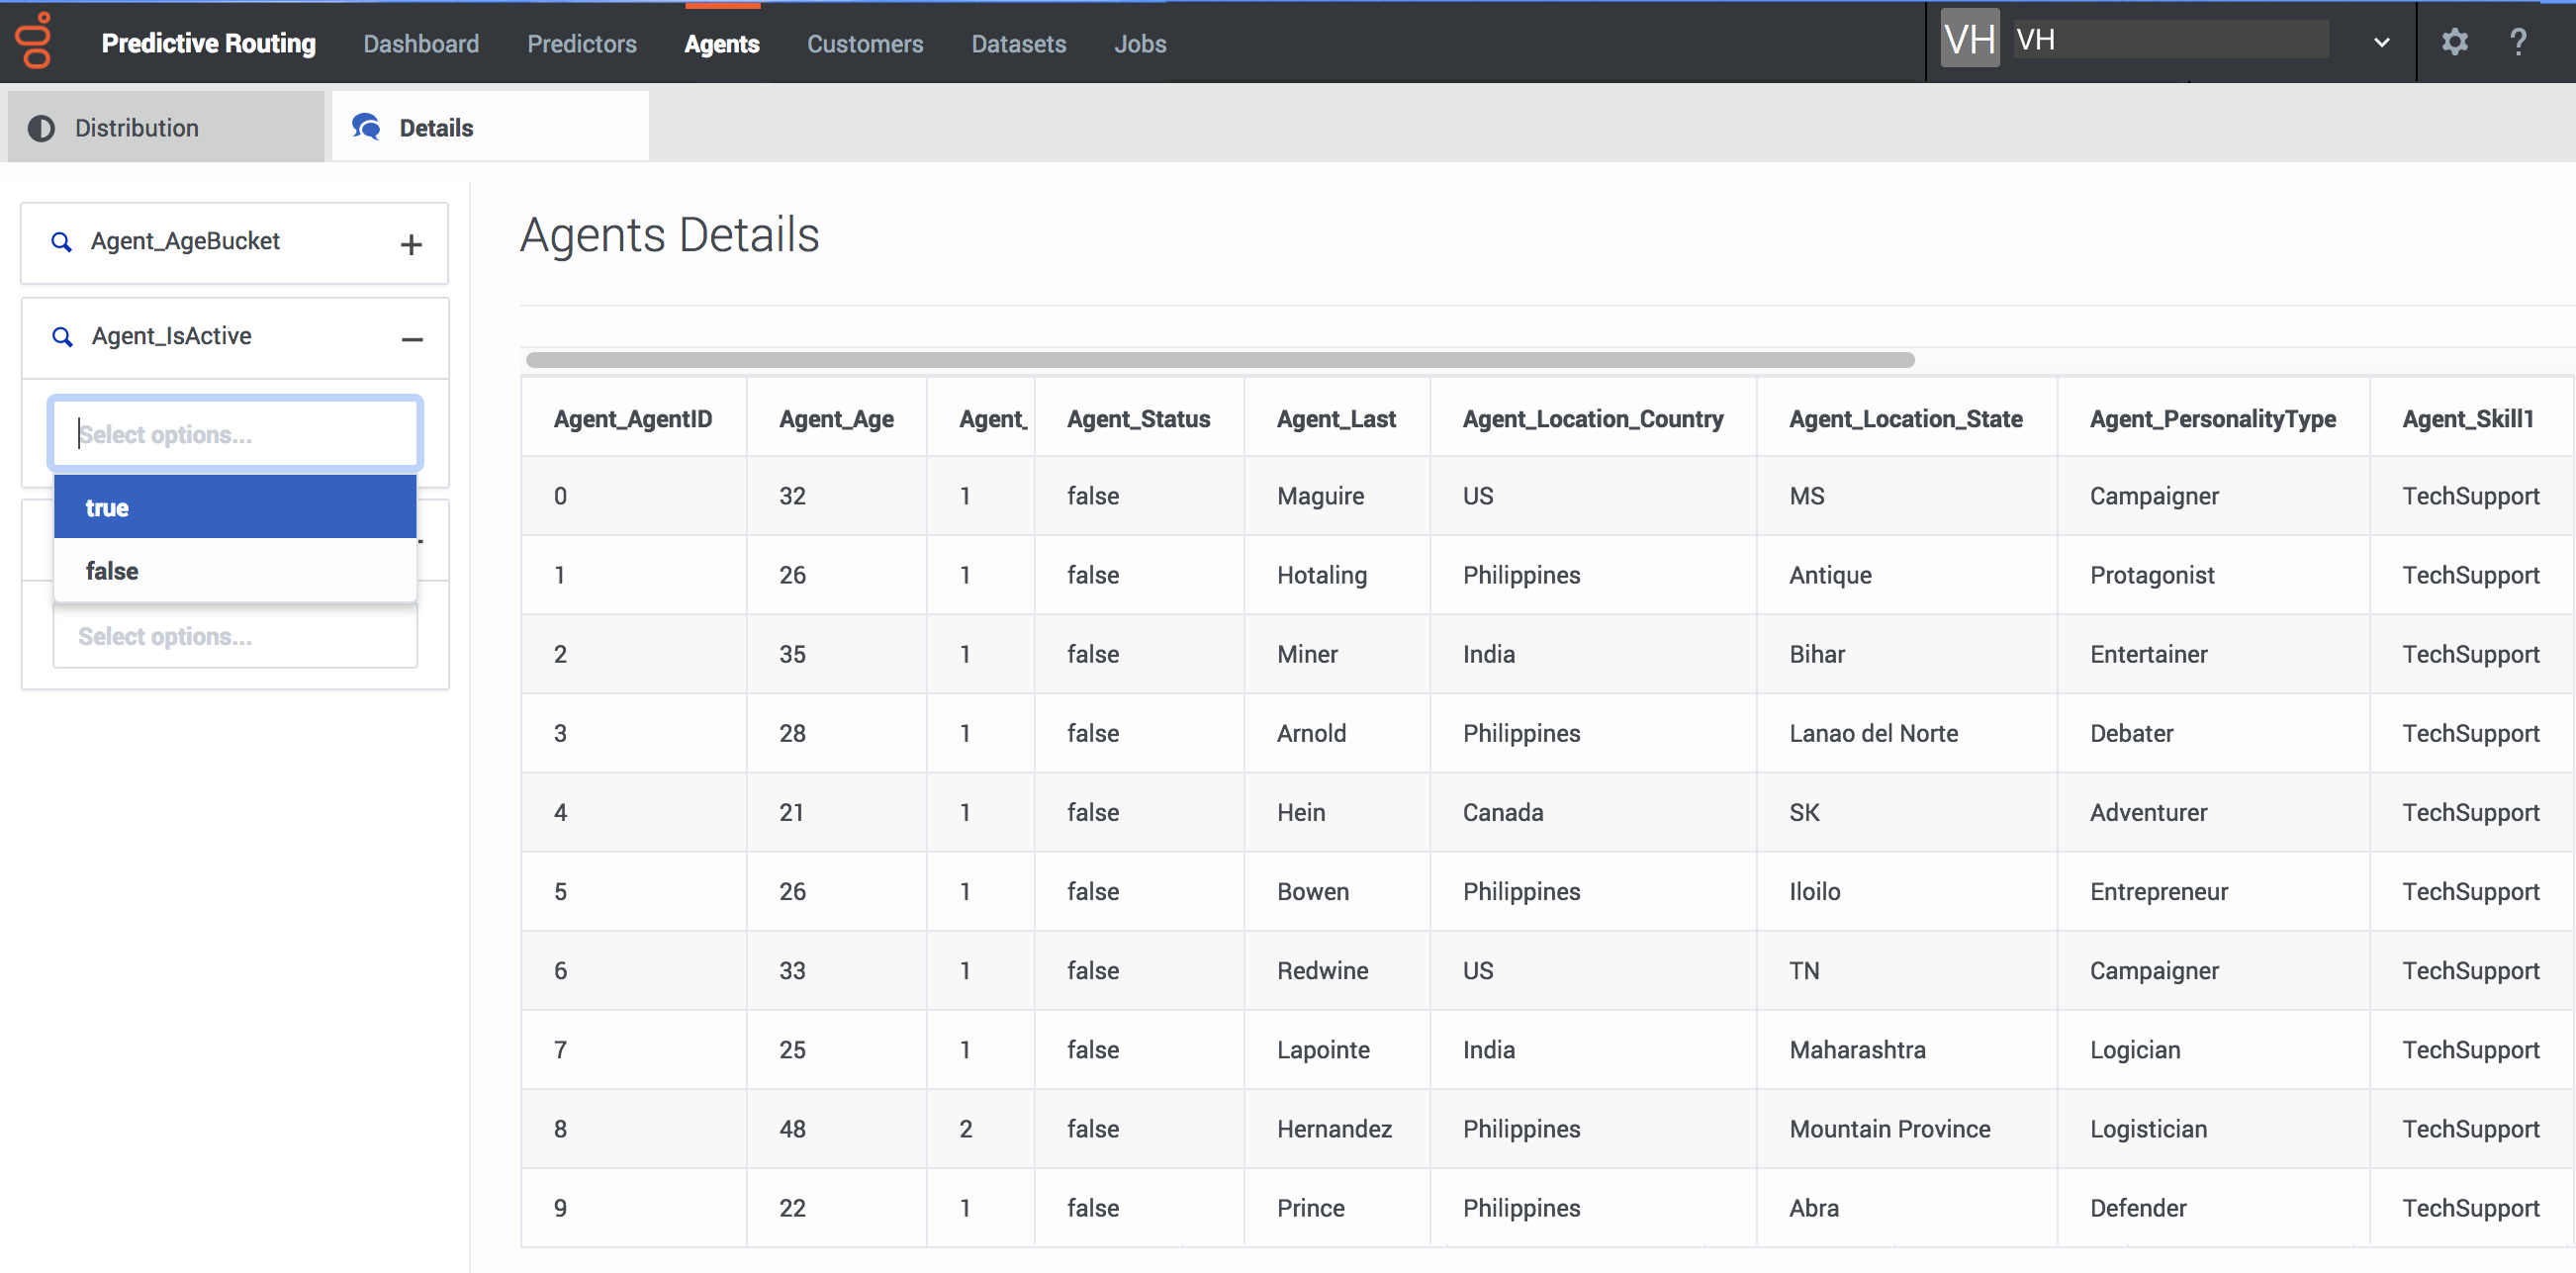
The Details tab enables you to parse your agent-related data, which is shown in the form of a table. To change the parameters taken into account:
- Use the Plot by drop-down menu.
- Choose from the various filters on the left side of the page. To make selections, click the + sign by a factor, then click in the text box that appears, which opens a drop-down menu of options.
- To change the date, use the date selector at the right side of the blue top navigation bar.
This page was last edited on January 3, 2019, at 16:35.
Comments or questions about this documentation? Contact us for support!


