
Traffic and Capacity Terms
Capacity Metrics and Formulas
Performance Metrics and Formulas
- Call Duration (CD) and Peak Capacity (PC)
- Call Setup Latency (CSL)
- Caller Perceived Latency (CPL), also known as Response Time Latency
- Call Passrate (CP)
Capacity Metrics and Formulas
Two units of measure are used for capacity planning: Call Arrivals Per Second and Port Density. This section also provides the formulas used to calculate capacity and performance.
Call Arrivals Per Second (CAPS)
CAPS measures traffic within the system. For example, 10 CAPS means that GVP is receiving 10 calls every second, which is considered busy traffic. CAPS is similar to Busy Hour Call Attempts (BHCA) or Centum Call Seconds (CCS), which is the legacy engineering term for telephony traffic.
Use the following formula to calculate CAPS in terms of CCS:
CAPS = CCS/36
CAPS measures can be applied to components which handle messages or data associated with a call. For example, the reporting server will have a CAPS value based on the number of call records written to it, which will often relate one-to-one with a completed call.
Throughout this chapter, including the tables, the capacity of a function and/or component is defined by its Peak CAPS (the maximum number of calls per second that the system can handle for that function without suffering from latency).
Port Density (PD) and Average Port Density
PD is the maximum number of simultaneous calls that can be served by GVP at any given time. In the tables of this document, PD is called “Peak Ports” because it also specifies the number of ports that are required to handle the call traffic.
Use the following formula to calculate Port Density:
PD = CAPS x Avg(CD)
...where Avg = Average.
Average Port Density (APD) is the average number of simultaneous calls that are being served by GVP at any given time. The formula to calculate APD is:
APD = CAPS x Average(Call Duration)
Due to PD being a random variable, it can be higher than its average value APD. Use the following formula to calculate Port Density:
PD = APD + 3*SQRT(APD)
...where SQRT(x) is the square root of x.
System Capacity is a function of the maximum number of ports (PD) or maximum call-arrival rate (CAPS) at which GVP can maximize its use of hardware resources, while maintaining all of the criteria within a predefined threshold.
Performance Metrics and Formulas
Four units of measure are used to assess performance—Call Duration, Call Setup Latency, Caller Perceived Latency, and Call Passrate.
Call Duration (CD) and Peak Capacity (PC)
CD is the length of time that a call stays in the GVP system. Use CAPS and CD to calculate the port density required for handling such traffic.
Instead of measuring individual Caller Perceived Latencies within an application under test, you can use data collected by GVP to measure the increase in the total call duration to determine system loading.
For a single call, the assumption is that the normal call duration (where the hang-up is performed by the application) is CD1. When the load increases on the system, the call duration is expected to increase due to an increase of latencies within the application. Assume that for x simultaneous calls in the system, the measured average call duration is Avg(CDx) and the measured 95th percentile call duration is 95%tile(CDx). The capacity measurement goal is
Avg(CDx) / CD1 <= 110%
95%tile(CDx) / CD1 <= 120%
When the 110% (and 120%) threshold is reached, the call volume x is considered to be the Peak Capacity (PC) for this criterion.
Call Setup Latency (CSL)
CSL is the delay between the initial SIP INVITE message and the first audible RTP packet sent from GVP.
CSL consists of the following requests and responses:
- User SIP INVITE request received > SIP 200 OK response sent.
- SIP 200 OK response sent > User SIP ACK request sent.
- User SIP ACK request sent > First audible media response sent.
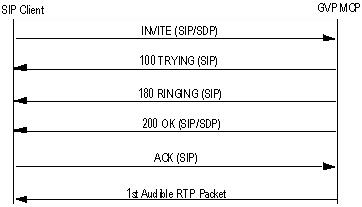 Figure: Typical SIP Call Flow #1
|
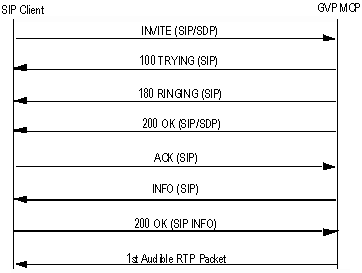 Figure: Typical SIP Call Flow #2 |
| CSL is the delay between the time that the initial SIP INVITE (top line from the typical call flows shown in both diagrams above) is received to the time that the first audible packet (bottom line from Figure: Typical SIP Call Flow #2) is sent out by GVP. | |
Other than call setup latency, SIP INFO response latency (from SIP INFO with MSML embedded to 200 OK response from MCP for SIP INFO request) is also an important factor. It should be measured and reported separately, although this duration is already part of call setup latency.
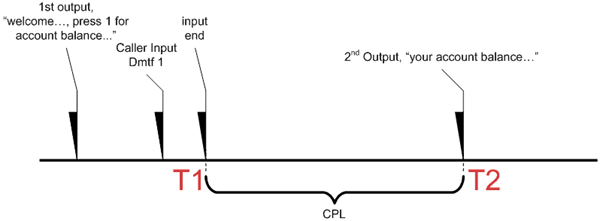
Caller Perceived Latency (CPL)
CPL, also known as Response Time Latency (RTL), is the time between the last user input (speech or DTMF) and the next prompt. As illustrated below, the time between T1 and T2 is the period of CPL.
Use the following formula to calculate CPL:
CPL = T2 - T1
CPL is impacted by the following factors:
- Recognition engines.
- End of speech or a DTMF time out.
- Application pages and prompts.
- Grammars caching and fetching mechanisms.
- The size of application pages.
- Call traffic, including call arrival rate and call duration.
- Speech density: during a call, the percentage of time that speech or DTMF detection is on and the caller can provide input.
- The size of speech recognition grammars and how often they are used in an application.
- Backend operation: the length of time required to obtain information from the business layer (such as, database queries and CRM findings) and return the results to the caller.
Call Passrate (CP)
CP is the measurement that indicates how many calls finished the pre-defined call flow successfully during the performance load test. For example, if a total of 1000 calls were placed, and five calls did not finish according to the call flow for any reasons, then the pass rate is:
(1000-5)/1000 = 99.5%
The capacity measurement goal is:
| ASR/TTS dependent application | Passrate >= 99.95% or Error rate <= 0.05% |
| DTMF only application | Passrate >= 99.99% or Error rate <= 0.01% |
CP is similar to call duration, in that when the threshold is reached at call volume x, then x is considered to be the peak capacity for this criterion.