
Multiple MCP Instances and Virtual Machines Test Cases
The Media Control Platform-only configuration is also measured with ESXi 4.1 Hypervisor VMs and multiple instances on the same host to compare performance metrics. The testing was conducted on a 2x Core 2Quad Xeon x5355, with a 2.66 GHz CPU, and 8 Cores with 12GB of RAM (higher than recommended).
- First Series: Multiple MCPs
- Second Series: Multiple MCPs
- Third Series: Multiple MCPs
- Jitter Quality on Virtual and Actual MCP Machines
First Series: Multiple Media Control Platforms
The first series of performance tests were conducted on servers with 1, 2, 4, and 8 VM images installed, and only one Media Control Platform on each VM, with the following hardware configuration:
- 1 VM 8 virtual CPUs 12 GB RAM for the VM
- 2 VM 4 virtual CPUs 6 GB RAM for each VM
- 4 VM 2 virtual CPUs 3 GB RAM for each VM
- 8 VM 1 virtual CPUs 1.5 GB RAM for each VM
To provide comparisons, the operating system used for the VMs was Windows 2008 Enterprise SP2, x86, which was also the operating system that is installed on the host used to test multiple Media Control Platform instances (1, 2, 4, and 8, respectively).
The VoiceXML_App1 (DTMF) was used as the standard application profile. Figure: Port Density—Virtual Machines Versus Media Control Platforms depicts the peak capacity that was obtained from the configurations that were described above.

Figure: CPU Usage—Virtual Machines Versus Media Control Platforms shows the highest peak capacity when 8 VMs (2600 ports) are configured, while the highest peak capacity when multiple Media Control Platform instances (2300 ports) are configured is at four instances (peak capacity is actually lower when eight Media Control Platform instances are configured). You can utilize the greatest number of ports when the number of VMs corresponds to the number of CPUs (Cores). However, using the multiple VM configurations results in a higher percentage of CPU usage. Figure: CPU Usage—Virtual Machines Versus Media Control Platforms depicts the number ports when CPU usage is measured during testing.

The graphs in Figure: Call Setup Latency Versus Port Density (Virtual Machines) and Figure: Call Setup Latency Versus Port Density (Actual MCPs) provide a comparison of the call setup latency when multiple VMs are configured versus multiple Media Control Platform instances.
The latency is lower when more VMs or more Media Control Platform instances are at the same port density, because with more VMs or more Media Control Platforms, fewer calls are distributed to each VM or Media Control Platform instance.
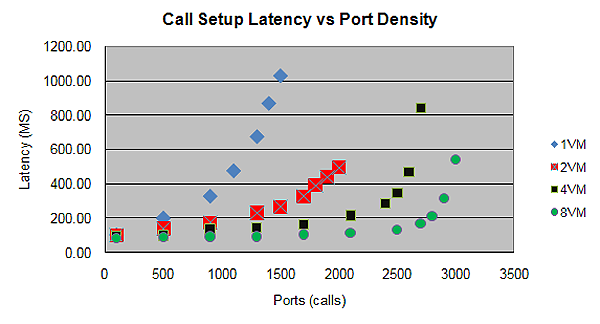

The next three graphs provide a comparison between multiple VMs and multiple Media Control Platform instances. The graphs depict 1-to-1, 2-to-2, 4-to-4, and 8-to-8 comparisons, respectively.

In Figure: Call Setup Latency Versus Port Density (1 VM-to-1 MCP), the same peak ports is achieved when comparing 1 Media Control Platform instance to 1 VM, however, the Media Control Platform produced lower call setup latency.

Figure: Call Setup Latency Versus Port Density (2 VM-to-2 MCP) indicates that 2 Media Control Platform instances perform better than 2 VMs with lower latency and higher peak ports.

Figure: Call Setup Latency Versus Port Density (4 VM-to-4 MCP) indicates that the performance of the 4 VMs and 4 Media Control Platform instances are quite close. The peak capacity and the latency trends are almost the same.

Figure: Call Setup Latency Versus Port Density (8 VM-to-8 MCP) indicates that 8 VMs perform better than 8 Media Control Platform instances. The VMs produce lower latency and higher peak ports.
Second Series: Multiple Media Control Platforms
The second series of performance tests were conducted on servers with 1 VM with 1 Media Control Platform instance using 1 CPU and then, the same configuration using 2 CPUs. These tests were executed by using 8 VMs and a 325-port load as the baseline, which is the highest peak capacity we could attain.
As shown in Table: CPU Usage—1 Media Control Platform per VM, the test conducted by using 2 CPUs (per VM) resulted in slightly higher CPU usage than the test with 1 CPU, while both results were only about 1/8 of the overall CPU usage when 8 VMs were configured.
Table: CPU Usage—1 Media Control Platform per VM
| VMs | MCPs per VM | CPUs per VM | Ports | Overall CPU Usage |
| 8 | 1 (8 total) | 1 (8 total) | 2600 | 83.69% |
| 1 | 1 (1 total) | 1 (1 total) | 325 | 9.45% |
| 1 | 1 (1 total) | 2 (2 total) | 325 | 9.76% |
Third Series: Multiple Media Control Platforms
The third series of performance tests were conducted on servers with 1 VM with 2 Media Control Platform instances and then, the same configuration with 2 VMs and 4 VMs, respectively. See Table: CPU Usage—2 Media Control Platforms per VM.
| VMs | MCPs per VM | CPUs per VM | Ports | Overall CPU Usage |
| 2 | 1 (2 total) | 4 (8 total) | 1600 | 69.14% |
| 2 | 2 (4 total) | 4 (8 total) | 1600 | 69.22% |
| 4 | 1 (4 total) | 2 (8 total) | 2200 | 80.10% |
| 4 | 2 (8 total) | 2 (8 total) | 2200 | 77.94% |
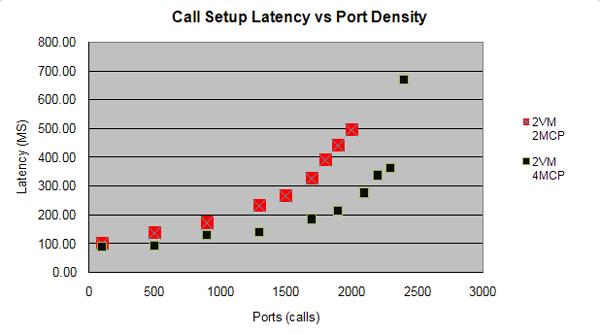
Test results do not indicate higher ports as capacity peaks, because CPU usage is already high. However, the call setup time gets shorter. See Figure: Call Setup Latency Versus Port Density—2 VMs and Figure: Call Setup Latency Versus Port Density—4 VMs.

Results indicated somewhat shorter call durations, as indicated in the next two graphs showing the 95 percentile of call duration.


The same test was repeated for GVP 8.1.5 on Windows 2008 Server R2 x64, with the latest hardware, which obviously achieves higher peak capacity. From the graph below, you can see that the latencies of x64 Win and x86 Win systems are quite in line with one another at lower ports, but a marked difference appeared at higher ports around peak capacity.
Jitter Quality on Virtual and Actual Media Control Platform Machines
Two metrics are used to measure jitter quality—Jitter Average (the weighted average of a stream's packets) and Jitter Max (the maximum number streamed packets). Two VMs and 2 Media Control Platform instances were used to test jitter quality. As expected, the results revealed some differences between the virtual and actual machines: See the next two graphs.


From the perspective of media latency, the difference is minor (less than or equal to 5%). In Figure: Speech Resource by Audio Latency, speech response latency was tested with 1000 words of grammar.

In Figure: Speech BargeIn to TTS Latency, speech bargein is compared to TTS latency the difference is between 20 and 50 milliseconds.
