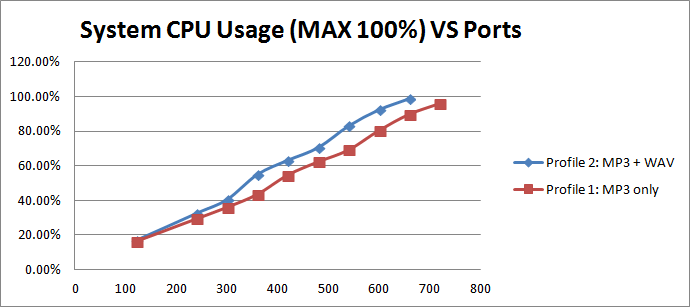
Performance Comparison of MP3 only and MP3 + WAV
The graph below compares two test profiles (Profile 1 of MP3 only and Profile 2 of MP3 + WAV as dest2) on the same hardware spec with same 6 VM configurations of 2 vCPU per VM. Below is the CPU usage:
Overall CPU usage for Software Profile 2 (MP3 + WAV) is slightly higher than for Software Profile 1 (MP3 only).
The two graphs below compare audio quality criteria:
- For this test, applying Profile 2 to a 6 VMs configuration: Preferred/Recommended = 360 ports; Peak Port Capacity = 530 ports, if you can ignore some potential impact to audio quality.
The table below shows the IOPS of the sum of all 6 VMs for a test profile of MP3 + wav:
Table: IOPS of sum of all 6 VMs of dual hex cores, MP3 + wav
| Ports | Overall Disk IOPS (kbps) | ||
|---|---|---|---|
| Total | Reads | Writes | |
| 120 | 42.64 | 0.01 | 42.63 |
| 240 | 77.69 | 0.00 | 77.69 |
| 300 | 95.99 | 0.00 | 95.99 |
| 360 | 114.28 | 0.00 | 114.28 |
| 420 | 130.45 | 0.00 | 130.45 |
| 480 | 149.58 | 0.00 | 149.58 |
| 540 | 172.49 | 0.00 | 172.49 |
| 600 | 194.55 | 0.00 | 194.55 |
| 660 | 177.80 | 0.00 | 177.80 |
The graph below compares Table: IOPS of sum of all 6 VMs of dual hex cores, MP3 + wav with Table: Disk IOPS of sum of all 6 VMs of dual hex cores, MP3 only:
As we have cache folder on a different SSD drive, we can break down disk IOPS for each drive as below:
Table: Disk IOPS Break Down per Drive, Test Profile 1, MP3 only
| Ports | Overall Disk IOPS (kbps) | SSD Drive E Disk IOPS (kbps) | HDD Drive C Disk IOPS (kbps) | ||||||
|---|---|---|---|---|---|---|---|---|---|
| Total | Reads | Writes | Total | Reads | Writes | Total | Reads | Writes | |
| 120 | 25.18 | 0.03 | 25.15 | 20.88 | 0.00 | 20.88 | 4.30 | 0.03 | 4.28 |
| 240 | 42.75 | 0.05 | 42.70 | 36.96 | 0.00 | 36.96 | 5.79 | 0.05 | 5.74 |
| 300 | 51.16 | 0.00 | 51.15 | 44.63 | 0.00 | 44.63 | 6.53 | 0.00 | 6.53 |
| 360 | 59.61 | 0.00 | 59.61 | 52.80 | 0.00 | 52.80 | 6.81 | 0.00 | 6.81 |
| 420 | 67.04 | 0.00 | 67.04 | 60.31 | 0.00 | 60.31 | 6.74 | 0.00 | 6.74 |
| 480 | 74.82 | 0.00 | 74.82 | 67.85 | 0.00 | 67.85 | 6.97 | 0.00 | 6.97 |
| 540 | 86.30 | 0.00 | 86.30 | 79.31 | 0.00 | 79.31 | 6.99 | 0.00 | 6.99 |
| 600 | 94.11 | 0.00 | 94.11 | 87.31 | 0.00 | 87.31 | 6.80 | 0.00 | 6.80 |
| 660 | 102.05 | 0.00 | 102.04 | 95.12 | 0.00 | 95.12 | 6.92 | 0.00 | 6.92 |
| 720 | 111.30 | 0.00 | 111.29 | 104.30 | 0.00 | 104.30 | 6.99 | 0.00 | 6.99 |
Table: Disk IOPS Break Down per Drive, Test Profile 2, MP3 + wav
| Ports | Overall Disk IOPS (kbps) | SSD Drive E Disk IOPS (kbps) | HDD Drive C Disk IOPS (kbps) | ||||||
|---|---|---|---|---|---|---|---|---|---|
| Total | Reads | Writes | Total | Reads | Writes | Total | Reads | Writes | |
| 120 | 42.64 | 0.01 | 42.63 | 38.38 | 0.00 | 38.38 | 4.26 | 0.01 | 4.26 |
| 240 | 77.69 | 0.00 | 77.69 | 72.07 | 0.00 | 72.07 | 5.62 | 0.00 | 5.62 |
| 300 | 95.99 | 0.00 | 95.99 | 89.04 | 0.00 | 89.04 | 6.95 | 0.00 | 6.95 |
| 360 | 114.28 | 0.00 | 114.28 | 107.50 | 0.00 | 107.50 | 6.78 | 0.00 | 6.78 |
| 420 | 130.45 | 0.00 | 130.45 | 123.56 | 0.00 | 123.56 | 6.89 | 0.00 | 6.89 |
| 480 | 149.58 | 0.00 | 149.58 | 142.65 | 0.00 | 142.65 | 6.92 | 0.00 | 6.92 |
| 540 | 172.49 | 0.00 | 172.49 | 165.61 | 0.00 | 165.61 | 6.88 | 0.00 | 6.88 |
| 600 | 194.55 | 0.00 | 194.55 | 187.53 | 0.00 | 187.53 | 7.02 | 0.00 | 7.02 |
The two graphs below compare corresponding drives:
This SSD drive is used exclusively as the cache folder for MCP recording. The IOPS for Profile 2 (two dest2, MP3 + wav) is as double as Profile 1 (one dest. MP3 only).
This HDD drive is used for all operations except the cache folder for MCP recording. IOPS is nearly constant at a regular load and below peak. Thus, the IOPS estimating formula can be:
IOPS1 = C + k * P (dest only)
IOPS2 = C + 2k * P (both dest + dest2)
Where P = ports, C = 7, k = 0.15


