Call Setup Latency Test Cases
In the following test cases, maximum capacity was achieved within the constraints of specific thresholds. However, the system was also tested beyond the recommended capacity to determine the extent of performance degradation.
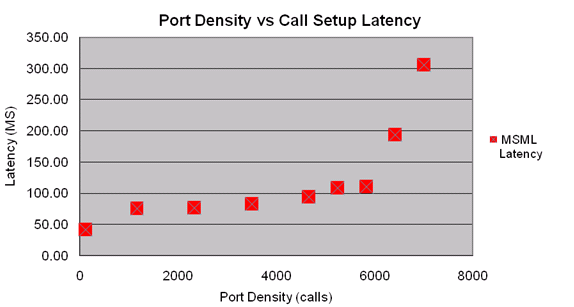
The test case in Figure: Port Density versus Call Setup Latency uses the VoiceXML_App1 profile (see VoiceXML Application Profiles) to show how the CSL increases as the PD increases. The rate at which the CSL increases is relatively constant until the system reaches a bottleneck—for example, when the system load is beyond peak capacity.
Caller Perceived Latency Test Case
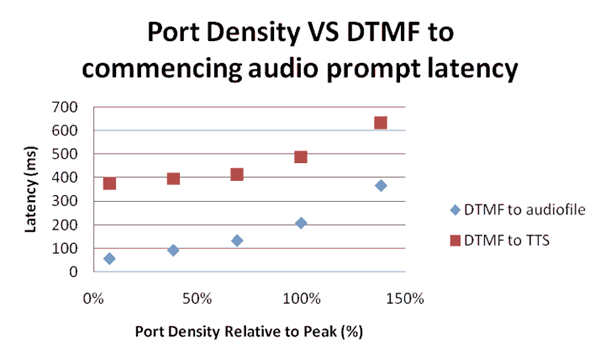
The graph in Figure: Port Density versus DTMF shows the DTMF response-to-audio-prompt latency at various port densities (relative to the peak capacity indicated in Table: GVP VOIP VXML/CCXML Capacity Testing). Notice that the TTS prompts produce ~300 ms more latency than the audio file prompts. This is due to the beginning silence played by the TTS engine.
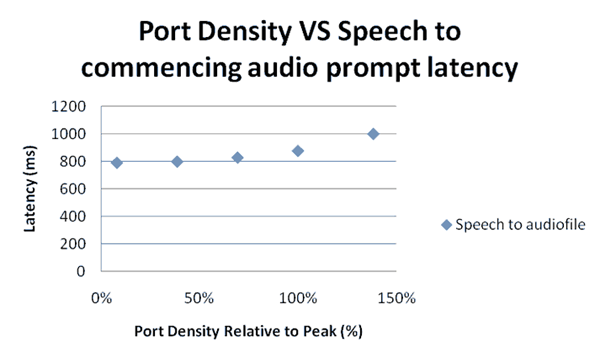
When there is speech input, additional latency is usually caused by the ASR engine. In Figure: Port Density versus Speech, the latency result from 1000 words of grammar using the Nuance OSR3 MRCP version 1 (MRCPv1) engine. The result can vary, depending on the type of MRCP engine used, the type of speech grammar used, and the load on the speech engine.
The performance results in Figure: Port Density versus Speech were obtained from isolated ASR engines supporting the same number of recognition sessions at all Media Control Platform port densities; the MRCP engines did not cause a bottleneck. Therefore, depending on the load on the Media Control Platform, it can add as much as ~100 ms of latency.