
Component Test Cases
The following component test cases are described in this section:
- Media Control Platform on Windows
- Media Control Platform on Linux
- Resource Manager
- MRCP Proxy
- PSTN Connector
- CTI Connector
- CTI Connector/ICM
- Supplementary Services Gateway
- Reporting Server
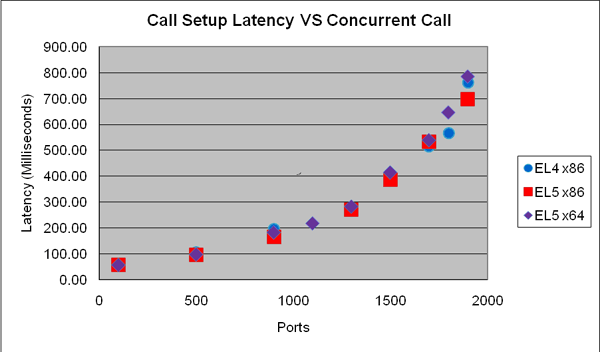
Media Control Platform on Windows
Testing was conducted on Windows 2003, Windows 2008 (x86 and x64), and Windows 2008 R2. But not all testing was executed in the same release. In general, performance results were similar when the Media Control Platform was installed on either version of Windows. The next Figure shows slight differences.
Figure: Call Setup Latency Versus Concurrent Calls (MCP on Windows) depicts the call setup latency metrics for each Windows version when the VoiceXML_App1 was executed as the background load.

The latency numbers are quite close for ports below 1300, while they are slightly higher on Windows 2003 when ports are 1300 or higher. This trend continues up to 1800 ports, at which point latency on Windows 2008 exceeds those on Windows 2003.
In Figure: System CPU Usage Versus Concurrent Calls (MCP on Windows), the graph depicts CPU usage for the overall system on each Windows version, when testing was performed by using VoiceXML_App1 and the results were scaled.

The CPU usage for both versions of Windows 2008 (x86 and x64) are almost identical to each other, trending a little higher than Windows 2003. Also, Windows 2003 can sustain higher ports than the preferred 1300—ignoring other factors such as call setup latency. Beyond 1300 ports, the Windows 2008 call pass rate drops below Genesys QA pass criteria of 99.99%. However, on Windows 2003, 1800 ports can be achieved within the pass criteria if call setup latency is ignored.
Media Control Platform on Linux
Testing was conducted on Red Hat Enterprise Linux 4, RHEL 5 (x86 and x64), and RHEL 6 x64. However, not all testing was executed in the same release. There were no significant differences in performance on RHEL 4 & RHEL 5 (both x86 & x64), while the performance was better on RHEL 5 than on RHEL 6.
Below is the graph of call setup latency measured in different Red Hat Linux systems on physical servers, when RHEL 6.x x64 (VXML_App1 was executed as background load: Figure: Call Setup Latency Versus Concurrent Calls (MCP on Linux) depicts the call setup latency metrics for RHEL 4 and RHEL 5 on physical servers when VoiceXML_App1 was executed as the background load.
All three Linux versions showed latency results that were almost in line with one another at 1700 ports or lower. Above 1700 ports, which is beyond Genesys QA preferred peak capacity, there were some differences.
In Figure: CPU Usage Versus Concurrent Calls (MCP on Linux), the graph provides a comparison of the overall CPU usage when VoiceXML_App1 is executed.

There were no significant differences between Linux versions for overall CPU usage, and overall performance was similar, even when multiple simultaneous factors, such as call setup latency and call pass rate, were considered.
Performance differences between Linux and Windows depends on specific use cases. The maximum number of concurrent ports on Linux is slightly higher than on Windows in some test cases in which there were more ports, such as MSML with CPD, but worse for other test cases, such as those in which G.711 and G.729 transcoding was used.
GVP overall performance on Linux and Windows is quite similar, and although the test cases performed on both Windows and Linux were not identical, the peak capacity was not significantly different.
Because performance suffers on RHEL 6.4 x64, the virtual environment was used only to test MCP on RHEL 6.x x64 as a guest OS on ESXi 5.0. Below is the comparison of call setup latency between EL5 x64 and EL6 x64 while both were on virtual environment as guest a OS:

Figure: Call Setup Latency vs. Ports (above) shows that call setup latency increased significantly on EL6 x64, compared with EL5 x64.
Resource Manager
Resource Manager performance was measured in terms of Call Arrivals Per Second (CAPS). Performance was not affected by the number of simultaneous calls held by Resource Manager. Resource Manager performed most efficiently when multiple Media Control Platforms were used.
The effect on Resource Manager performance differs, depending on the type of call being processed (for example, conference versus announcement calls), but generally, a peak of 800 CAPS can be sustained for call types such as call routing and conference, and regardless of whether it is in an HA or non-HA configuration. This applies to all Windows versions and most RHEL servers except RHEL 6 x64.
CPU consumption on Resource Manager is very low. The 800 CAPS limit mentioned previously is due to the use of virtual memory, which exceeds the 3GB limit (configured at the OS level) when Resource Manager is running consistently beyond 800 CAPS.
The same capacity results were achieved when the Resource Manager was tested using both UDP and TCP due to a bottleneck when it reached the 3GB virtual memory limit.
Figure: CAPS Versus CPU Usage (Resource Manager) depicts CPU usage when Resource Manager is installed on Red Hat Enterprise Linux 5 x86.
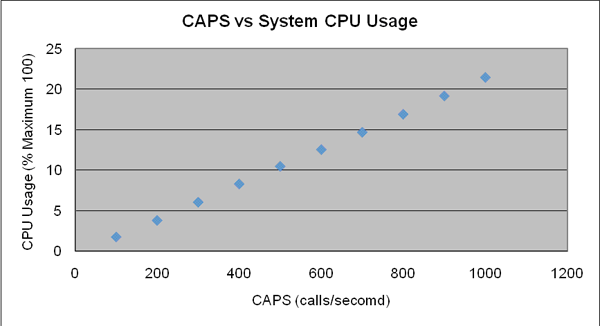

Figure: CAPS Versus Memory Usage (Resource Manager) shows that the Resource Manager can sustain 900 CAPS. However, since the memory usage almost reaches the 3GB limit, a 800 CAPS peak capacity seems more appropriate.
When configured with the Reporting Server, Resource Manager sustained 800 to 900 CAPS, but the Reporting Server performance invariably caused a bottleneck to occur. See Reporting Server.
When a single tenant (Environment by default) is used, 800 CAPS is achieved (see Figure: CAPS Versus Memory Usage (Resource Manager)). When multiple tenants are configured, the Resource Manager performance is slightly degraded. When tested with 1000 tenants, each configured with 1 child tenant, the Resource Manager performance achieves 600 CAPS of peak capacity.
When a large number of Direct Inward Dialing (DID) numbers are configured in a single tenant, the Resource Manager performance, again, is slightly degraded. When 100,000 DID numbers are tested with 262 IVR Profiles (without the use of DID ranges or wild cards, for example, a long, simple mapping list), peak capacity is 600 CAPS.

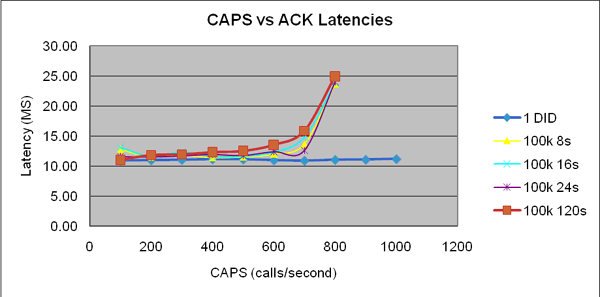
Figure: CAPS Versus SIP INVITE Latencies (Resource Manager) depicts the propagation of SIP message latencies between 1 and 100,000 DID numbers with various call durations, and shows higher latencies for SIP INVITE messages for 100,000 DID numbers versus the 1 DID baseline, while there is not much difference in latencies with SIP ACK messages (see Figure: CAPS versus INVITE Latencies (Resource Manager) and Figure: CAPS Versus SIP BYE Latencies (Resource Manager)). The delay likely occurs when Resource Manager searches for mappings upon receiving SIP INVITE messages. The testing also indicates that call duration is not relevant to Resource Manager performance.
The two previous scenarios (1000 tenants with one DID entry each and 100,000 DID in a single tenant) produce the worst results. Resource Manager can achieved better performance results when multiple tenants are configured with a small number of DID entries per tenant. Resource Manager was tested with the requirement of 1 million DIDs distributed among 32 tenants, each containing 30-35 K of DID entries. (A 4MB size limitation exists for Management Framework objects). Even in this configuration, the Resource Manager still achieved 800 CAPS.

In Figure: CAPS Versus SIP INVITE Latencies (Resource Manager), the SIP INVITE latency is almost in line with one DID entry until capacity reaches 900 CAPS, then it increases. The virtual memory is also close to the 3GB limit.
Performance superiority of RHEL 5 x86 over RHEL 6 x64 was observed during RM testing. Below is the graph for propagating latency of INVITE to compare RHEL 6 x64 and RHEL 5 x86:

Latency increased significantly on RHEL 6 x64, even at low CAPS.
MRCP Proxy
The MRCP Proxy performance is measured in terms of MRCP sessions and is benchmarked by using simulated MRCP v1 servers and clients. A typical 10 second MRCP session for either an ASR or TTS request used for testing.
The peak capacity is achieved at 1,600 concurrent MRCP requests per second (half ASR and half TTS) in CAPS, but the MCRP Proxy can hold 16,000 MRCP sessions in total. Beyond 1600 CAPS, it might still respond. However, the entire session becomes quite lengthy and will eventually time out. Figure: ASR Call Duration Versus CAPS—MRCP Proxy (MRCPv1) and Figure: TTS Call Duration Versus CAPS—MRCP Proxy (MRCPv1) depict the ASR and TTS 95th percentile of call duration. The results indicate that the call duration beyond 800 CAPS more than doubles.


Figure: TTS Call Duration Versus CAPS—MRCP Proxy (MRCPv1) and Figure: System CPU Usage Versus CAPS—MRCPv1 (MRCP Proxy) depict the overall CPU usage for the MRCP Proxy. The CPU usage increases substantially beyond 1600 CAPS.

As shown in Figure: System CPU Usage Versus CAPS—MRCPv1 (MRCP Proxy), the same significant increase in memory (private bytes) consumption beyond 1600 CAPS, is indicated.
PSTN Connector
The performance of PSTN Connector is measured in terms of T1/E1 spans. Two Dialogic DMV Media Boards, which provide 8 T1/E1 spans, were tested in a machine with a Dual Xeon, 3.0GHz CPU. Also, all other components such as the Media Control Platform, Resource Manager, and SIP Server were installed off board.
- Two different protocols were used—ISDN and CAS/RB Wink.
- Two application profiles were used—VoiceXML_App1 and VoiceXML_App3.
- The overall CPU idle was approximately 80% for both applications.
CTI Connector
CTI Connector performance was tested in two scenarios, in which a Play Treatment application was used with two different transfer types (a bridge transfer and a blind transfer)NGI. The Media Control Platforms were configured to use NGI and GVPi, respectively.
Two test cases where GVPi was used produced 25 CAPS on Windows and Linux. A test case in which the NGI was used in a blind transfer scenario produced 25 CAPS on Windows and Linux, while a bridge transfer produced only 15 CAPS on all supported Windows versions and 20 CAPS on Linux.
Beyond peak capacity, the overall call-pass-rate dropped below the 99.95% criteria. Figure: PD Versus CPU Usage (CTI Connector) is a sample of the CTI Connector overall CPU usage versus port density CAPS when NGI is used in a blind transfer scenario:

CTI Connector/ICM
The CTI Connector 8.1.4 is integrated with Cisco Intelligent Contact Management (ICM), enabling customers to choose between two Computer Telephony Integration (CTI) deployment modes—Genesys CTI or Cisco CTI.
In these test cases, CTI Connector/ICM performances measured in CAPS and testing was conducted by using two ICM modes of operation—Service Control Interface (SCI) and Call Routing Interface (CRI).
Two bridge transfer scenarios and a blind transfer scenario were tested with CED, Call, and ECC variables passing from the Media Control Platform to ICM. Multiple Media Control Platform instances, configured to use NGI only, achieved the following results:
- One ICM configured in CRI mode achieved 22 CAPS on Windows and 18 CAPS on Linux with GVP 8.1.4 or earlier, and 22 CAPS with GVP 8.1.5.
- Two ICMs configured in SCI mode on both Windows and Linux achieved 30 CAPS.
- Test results indicated a bottleneck on the ICM side of the platform. The graphs in Figure: CPU Usage Versus CAPS—Blind Transfer (CTI Connector/ICM) and Figure: CPU Usage During Blind Transfer (CTI Connector/ICM) depict a sample of the CPU usage when CTI Connector/ICM performs a blind transfer in SCI mode on Windows 2008 R2.
Supplementary Services Gateway
The Supplementary Services Gateway makes outbound calls through SIP Server, therefore, the call rate (or CAPS) is used to measure the Supplementary Services Gateways performance. Figure: HTTP Request CAPS Versus Notification CAPS provides a comparison of launching call rates (HTTP Requests or targets) and notification of completed calls: (real or achieved CAPS).

The Supplementary Services Gateways peak capacity result is 65 CAPS (using GVP 8.1.5 with SIP Server 8.1.0), 50 CAPS (using GVP 8.1.3 or later and SIP server 8.0.4) and 40 CAPS (using pre-GVP 8.1.3 and pre-SIP Server 8.0.4). These results are due to a bottleneck on the SIP Server side of the network--multiple Media Control Platforms are used to provide a sufficient number of ports to handle VoiceXML applications, regardless of their complexity. The call rate can exceed SIP Servers peak capacity, but the requests (which are stored on the database server) tend to accumulate. If egress rate is not high enough, the stored request records can easily reach the database limit of 100,000 records.
Reporting Server
Like the Resource Manager, Reporting Server performance is measured in terms of CAPS. The number of simultaneous calls being processed by GVP does not affect performance and there are no known performance bottlenecks with the Reporting Server software. However, performance can be affected by the database setup. When the Reporting Server is tested without the Media Control Platform in No DB mode (Reporting Server drops all call data), it can achieve 800 CAPS.
Capacity reached 800 CAPS when the Reporting Server was tested in No DB mode with the Resource Manager only (no MCP), and in that configuration, the Reporting Server drops all received call data.
A use case was conducted on Microsoft SQL 2008 and Oracle 10g R2 Enterprise Servers, with the Resource Manager and the Media Control Platform streaming information (including CDR, upstream, and SQA data) to the Reporting Server for each call with a default log level. The result was a peak capacity of 270 CAPS.
The same use case was conducted on an Oracle 11g Enterprise Server only; the result was a peak capacity of 300 CAPS.
The Reporting Server can connect to other GVP components by using TCP or TLS.