
Application Test Cases
The following application test cases are described in this section:
- NETANN Announcement
- MSML Announcement
- Transcoding
- Secure RTP
- Conference Performance
- HR Timer
- MSML CPA/CPD Performance
NETANN Announcement
When the Media Control Platform acts as a media announcement server, high call rates can be sustained. Using a NETANN announcement application, it can sustain up to 200 CAPS (~1100 ports) for a typical audio playback of 3.3 seconds, however, call setup and tear down latency increases.
Figure: CAPS versus Call Duration (Announcement) shows call durations at various CAPS. When CAPS reaches its peak (200 CAPS), the setup and tear down latency can reach 3.3 seconds. Optimally, call setup and tear down latency should be maintained at <1sec (or 500 ms each) with CAPS at 150 (with 600 ports).
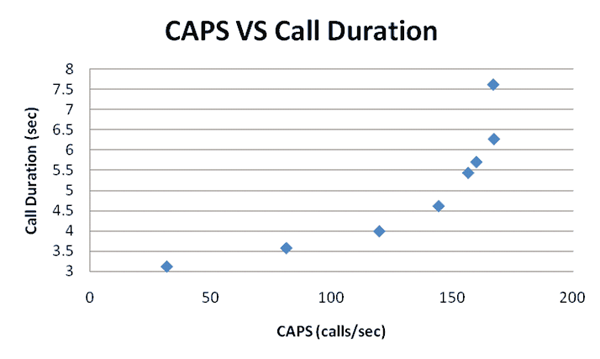
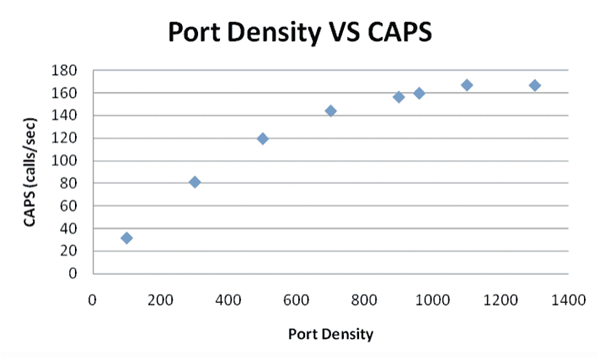
Figure: Port Density versus CAPS (Announcement) illustrates that, as the call duration increases with higher port density, the additional call setup and tear down latency prevents the CAPS from scaling linearly in relation to the port density.
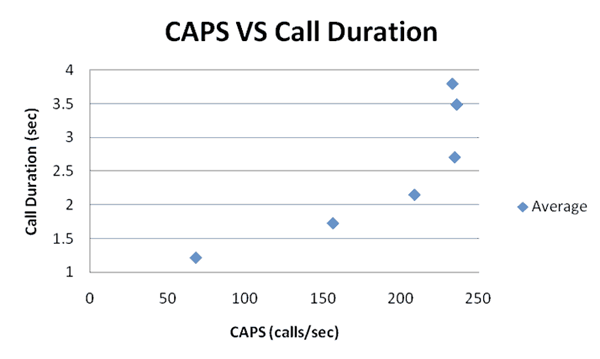
In Figure: CAPS versus Call Duration (Average), a bottleneck is caused by the media streaming. Shorter audio announcements increase the time spent on call setup and tear down and, although the load on the system decreases, shorter audio prompts cause the peak CAPS to increase. The graph depicts a use case where a one-second audio announcement drives the peak CAPS to ~235. Optimally, in this use case, call setup and tear down latency should be maintained at <1sec and CAPS at 200 (with ~500 ports).
MSML Announcement
MSML announcement applications of 3, 10, and 20 second durations were tested on RHE Linux 5, Update 4, x64. Announcement applications were tested to compare:
1 prompt/1 request vs. 2 prompts/1 request vs. 2 prompts/2 requests vs. 3 prompts/3 requests, in the following scenarios:
MSML Announcement - 3 second duration
1 audio file with 1 prompt (SIP INFO)
MSML Announcement - 10 second duration
1 audio file (10s) with 1 prompt (SIP INFO)
2 audio files (4s and 6s); 1 prompt (SIP INFO)
2 audio files (per prompt); 2 prompts (SIP INFO)
MSML Announcement - 20 second duration
1 audio file (20s) with 1 prompt (SIP INFO)
3 audio files (4s, 6s, 10s) with 1 prompt (SIP INFO)
3 audio files (per prompt) with 3 prompts (SIP INFO)
A 3-second audio file, with a single prompt (SIP INFO) and gvp:precheck turned on, resulted in a peak capacity of 80 CAPS or 260 ports, which is lower than the NETANN preferred capacity of 120 CAPS or 500 ports. Figure: CAPS Versus Port Density—NETANN and MSML Announcement (Linux) provides a comparison of the test scenarios.

In Figure: CAPS versus Port Density—NETANN and MSML Announcement (Linux) (above), testing starts to fail beyond 80 CAPS in the MSML test case. The call duration deviation is better than in the NETANN test case. See Figure: Port Density versus ACD—NETANN and MSML Announcement (Linux) (below).

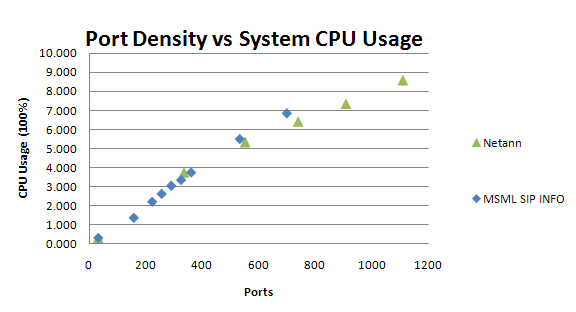
Overall system CPU usage is illustrated in the graph in Figure: Port Density versus System CPU Usage—MSML and NETANN (Linux). Overall CPU usage is quite similar, but MSML test case is slightly higher than NETANN at high ports, which is beyond peak capacity.
As indicated by the graph in Figure: Port Density versus ACD—MSML Application (Linux), performance for the 10-second announcement application when gvp:precheck is turned off, is almost the same with 1 or 2 audio files in a single prompt (200 CAPS or 2000 ports) while two prompts (SIP INFO) only achieve 130 CAPS or 1400 ports.

In Figure: Port Density versus ACD—MSML Application (Linux) The performance of 2 single prompt test case results are quite similar, while the call duration increases significantly for the 2 prompts scenario. There is some trending in the overall CPU usage in Figure: Port Density versus MCP CPU Usage—MSML Application (Linux).
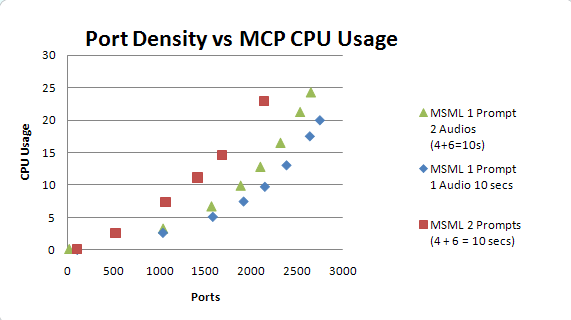
In the 2 prompts test case in Figure: Port Density versus MCP CPU Usage—MSML Application (Linux), the CPU usage is significantly higher than in the 2 single-prompt test.
In a 20-second announcement scenario with gvp:precheck turned off, when there are more audio files, even in a single prompt, performance is impacted: 130 CAPS or 2600 ports for three audio files in a single prompt versus 150 CAPS or 3000 ports for one audio file in a single prompt.
Multiple prompts may also downgrade the performance, in that only 100 CAPS, or 2000 ports are achieved in the 3 prompts test case (3 SIP INFO messages).
MSML Announcement Latency
Latencies for MSML Play Announcement are measured using the following metrics: call setup latency (from INVITE to first RTP packet), SIP INFO (with MSML) response latency and Inter-prompt latency. The background load is a prompt (G.711), audio-only, lasting 120 seconds.
Below are two graphs for call setup latency of MSML Play Announcement on a four-VM setup of vSphere using two Xeon E5620 CPUs (eight cores) with 16GB RAM. Each VM uses two vCPUs and 4GB RAM. The guest OS is Windows 2008 Server R2 Enterprise. The graph in Figure:CAPS vs. Call Setup Latency shows the latency (in milliseconds) based on call rate and the other shows port density. A small jump in latency occurs when the load goes above 50 cps or 6000 ports. The latency is still below acceptable criteria (500 ms). The overall CPU usage approaches 70% when the CAPS rate is 50.
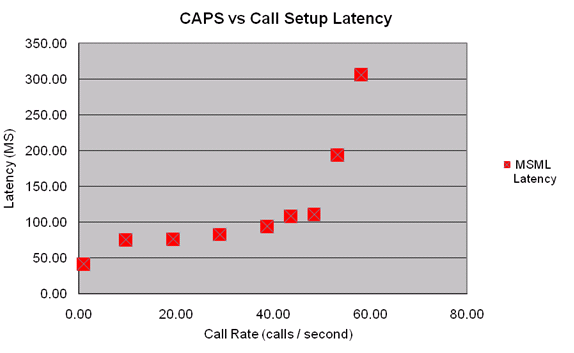
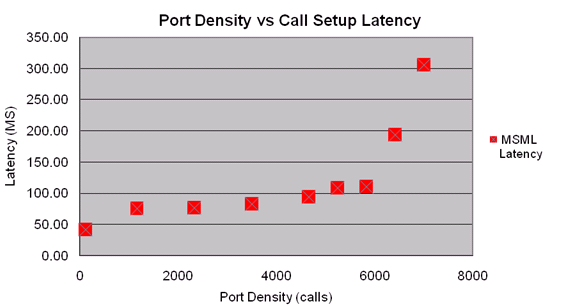
Figure: Inter-Prompt Latency vs. Ports, displays a small jump in inter-prompt latency (using audio files) when the load goes beyond 6000 ports.
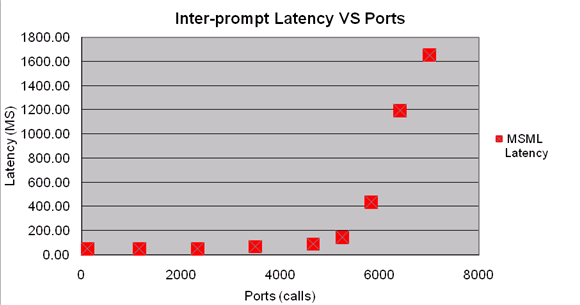
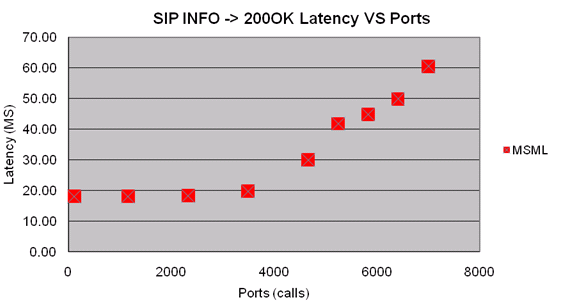
Figure: SIP INFO -> 200OK Latency vs Ports shows the SIP INFO (with MSML embedded) response (200 OK) latency.
MSML Video Play Performance
Several factors can affect the performance of Video Play using MSML Announcements such as resolution, bit rate, and frame rate. For H.263 video (tested using the AMR audio codec), the following tests were chosen for analysis and comparison:
- CIF, 512 Kbps bit rate (high), 30 fps (high)
- CIF, 128 Kbps bit rate (low), 10 fps (low)
- 4CIF, 2 Mbps bit rate (high), 30 fps (high)
- 4CIF, 512 Kbps bit rate (low), 10 fps (low)
Tests were conducted using three VMs under vSphere 5.0 on a single hex-core machine using Xeon X5670. Each VM was assigned two vCPUs with only one MCP installed on each VM. The results of each test follow.
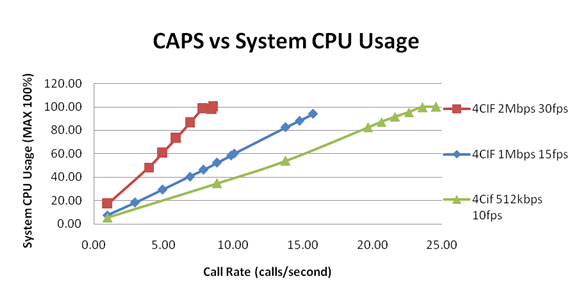
In CAPS vs. System CPU Usage 2 and CAPS vs. System CPU Usage 3 (below), the dominant factor of peak capacity is the frame rate, while the impact from both bit rate and resolution is small. The CPU is the apparent bottleneck in these tests, meaning that additional capacity can be reached with more powerful CPUs.
For H.264 video (with AMR audio), using finer granularity resulted in more groups of combinations:
- CIF, 512 Kbps bit rate (high), 30 fps frame rate (high)
- CIF, 256 Kbps bit rate (middle), 15 fps frame rate (middle)
- CIF, 128 Kbps bit rate (low), 10 fps frame rate (low)
- 4CIF, 2 Mbps bit rate (high), 30 fps frame rate (high)
- 4CIF, 1 Mbps bit rate (middle), 15 fps frame rate (middle)
- 4CIF, 512 Kbps bit rate (low), 10 fps frame rate (low)
- 720P, 4 Mbps bit rate (high), 30 fps frame rate (high)
- 720P, 2 Mbps bit rate (middle), 15 fps frame rate (middle)
- 720P, 1 Mbps bit rate (low), 10 fps frame rate (low)
A similar trend is evident when testing H.264. The first of the following graphs shows how varying bit rate and frame rate, while keeping the resolution constant (4CIF), affects CPU usage. The second graph shows how varying the resolution and bit rate, while keeping the frame rate constant (15 fps), affects CPU usage.

Keeping the resolution constant and varying the frame rate and bit rate causes larger variations in CPU usage and peak capacity, while keeping the frame rate constant and varying the resolution and bit rate does not.
MSML MP3 Play & Recording Performance
MP3 playback using MSML Announcements was tested using the G.711 ulaw audio codec on the RTP channel. The MCP was required to transcode from MP3 to G.711 ulaw during this test. Two types of MP3 files were used in these tests:
- 96K bit rate, 32KHz sampling stereo
- 320K bit rate, 44.1KHz sampling stereo
Testing was conducted with three VMs running under vSphere 5.0 on a single hex-core Xeon X5670 processor machine. Each VM was assigned two vCPUs and each ran a single MCP instance.
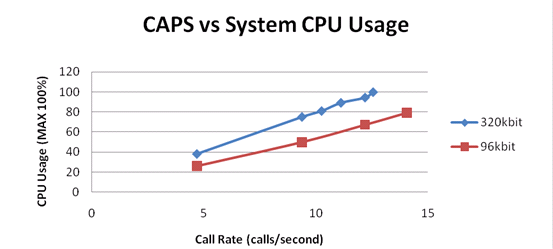
Transcoding involves additional CPU resources. Lower bit rate and lower sampling rates will use fewer CPU resources and achieve a higher peak capacity. The chart CAPS vs. System CPU Usage 4 depicts overall CPU usage vs. call rate for the above mentioned MP3 files:
An MP3 recording using the same two bit rates resulted in a lower peak capacity, since a disk speed bottleneck was reached before CPU saturation occurred.
Transcoding
The Media Control Platform can transcode various media codecs in real time. The impact on performance from transcoding overhead varies, depending on the codec that the Media Control Platform is transcoding to or transcoding from. Other variables that contribute to transcoding overhead are the number of audio prompts played by GVP and the amount of customer input received.
The worst case scenario occurs when the Media Control Platform is constantly transcoding between two codecs during the entire call. (Most VoiceXML applications require minimal encoding [G711u to AMR]). In Figure: Port Density versus CPU Usage (G711u and G711a), the least amount of transcoding overhead is between G711u and G711a codecs, where the peak capacity drops by ~25%.

Figure: Port Density versus CPU Usage (G711u and AMR) illustrates the impact of transcoding overhead. It is greater between the G711u and AMR codecs, where the peak capacity drops by ~75%.
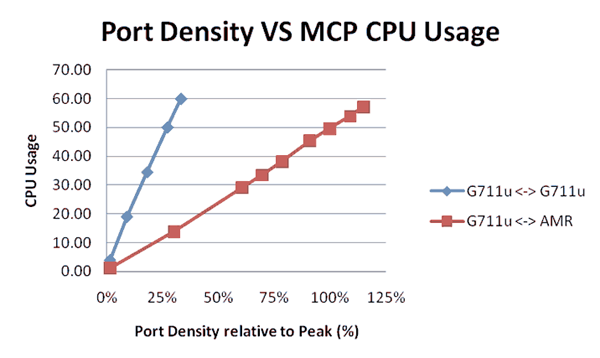
The transcoding test cases in this section depict a worst case scenario involving constant transcoding between two codecs. However, in a call flow scenario where the audio stream was suppressed or silent, and the application was waiting for user input 50% of the time, transcoding overhead would be reduced by 50%.
Video Transcoding Performance
Beginning with release 8.1.5, the MCP is capable of performing video transcoding. Video Transcoding Performance was measured using bridge transfers containing video and audio streams. Video transcoding requires more CPU resources than audio-only transcoding. A video bridge transfer without transcoding can achieve hundreds of ports on a machine containing 3 VMs running on vSphere 5.0, with a single hex-core Xeon X5675 processor. On the same machine, video bridge transfers that involve video transcoding can range from single digit port numbers to a few dozen. Peak capacity is affected by resolution, frame rate and bit rate.
Transcoding was tested with video codec H.264 and AMR audio codec. The testing was divided into groups that consist of resolution downscaling, frame rate downscaling and bit rate downscaling. Figure: Port Density vs. System CPU 1 displays the group of resolution downscaling from VGA to CIF and QCIF, respectively, with the same frame rate of 30. It shows the transcoding performance drops up to ~80%.
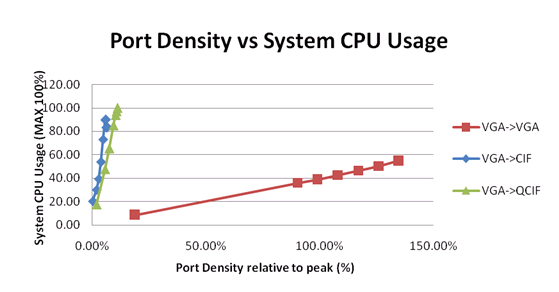
Figure: Port Density vs. System CPU 2 displays the focus for transcoding only:
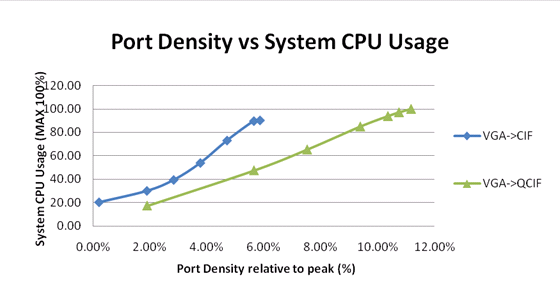
With higher resolution, downscaling transcoding of the performance drops even further. Figure: Port Density vs. System CPU 3 is a graph for transcoding from 720P to CIF and QCIF. Performance drops up to ~90% for VGA to QCIF while ~95% for VGA to CIF transcoding.
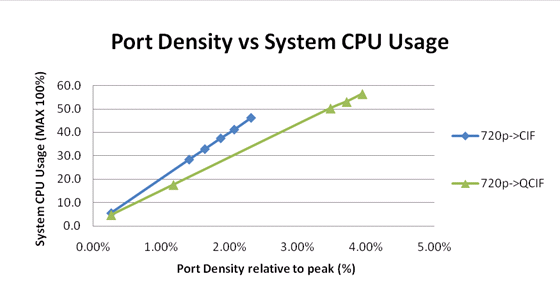
in Figure: Port Density vs. System CPU 4, performance dropped more than 95% when tested with a downscaled frame rate and the same resolution (VGA).
Secure RTP (SRTP)
Secure Real Time Protocol performance testing was conducted by using two bridge transfer scenarios with unidirectional RTP/SRTP streams; one included PCMU audio-only, and the other, a 3gp container of H.264 video plus AMR audio. The PCMU audio-only transfer was tested on both Windows and Linux, while the video plus audio transfer was tested on Linux only.
Tests were conducted with SRTP in the following scenarios (and one with RTP-only) to provide comparison of results:
- Baseline of RTP-only (without SRTP)
- Default SRTP mode (encrypted and authenticated) encryption
- Default SRTP mode (encrypted and authenticated) decryption
- Unencrypted SRTP mode (authenticated only) encryption
- Unencrypted SRTP mode (authenticated only) decryption
- Unauthenticated SRTP mode (encrypted only) encryption
- Unauthenticated SRTP mode (encrypted only) decryption
The test results suggest that peak capacity is almost the same for SRTP and RTP, regardless of the SRTP mode used. The audio-only tests resulted in 1200 ports achieved on Windows and 1500 ports on Linux, and 400 ports for the video + audio test case (on Linux only).
Capacity results were also the same regardless of SRTP mode. However, CPU utilization results varied.
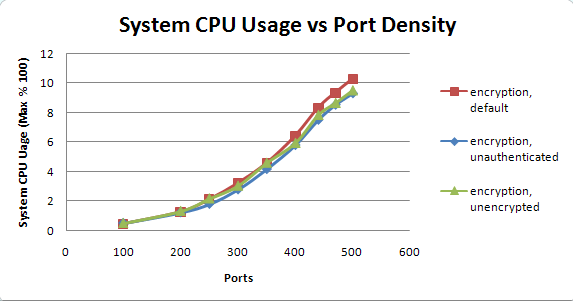
Figure: System CPU Usage versus Port Density—Test Cases 1, 2, 3 depicts the audio-only test case on Windows, comparing CPU usage in testing scenarios 1, 2, and 3.
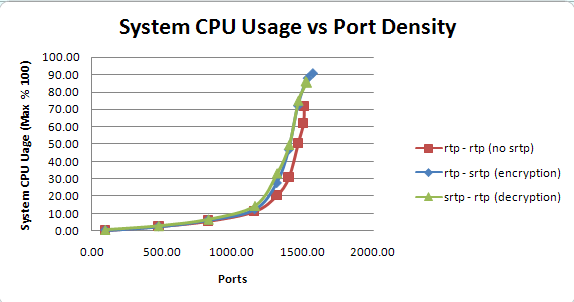
Figure: System CPU Usage Versus Port Density—Test Cases 2, 4, 6 depicts the audio-only test case on Windows, which compares CPU usage in testing scenarios 2, 4, and 6.

In Figure: System CPU Usage Versus Port Density—Test Cases 2, 4, 6, CPU usage increases beyond 1200 ports (launching 1300 ports), meaning the peak capacity is also 1200 ports. The following additional results were observed:
- In the encryption scenario, the overall system CPU usage increased from 11.4% to 12.5%—a 10% increase at 1200 ports.
- In the decryption scenario, the overall system CPU usage increased from 11.4% to 14.4%—a 26% increase at 1200 ports.
The difference in CPU usage is negligible whether SRTP is configured in default (encrypted and authenticated), unencrypted, or unauthenticated mode.
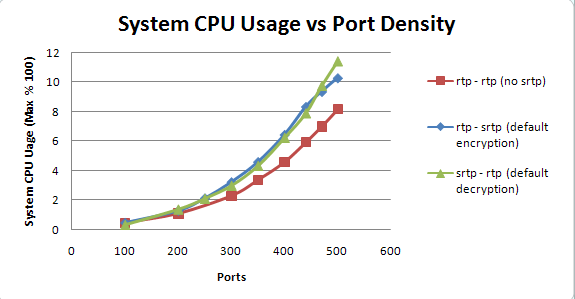
In Figure: System CPU Usage versus Port Density—Audio-Only Test Case, the audio-only test case (on Linux), the CPU usage is more linear than on Windows, therefore, 1500 ports (launching 1700 ports) is considered peak capacity. The following additional results were observed:
- In the encryption scenario, the overall CPU usage increased from 22.8% to 33.1%—a 45% increase.
- In the decryption scenario, the overall CPU usage increased from 22.8% to 31.4%—a 38% increase.
The difference in CPU usage is negligible whether SRTP is configured in default (encrypted and authenticated), unencrypted, or unauthenticated mode.

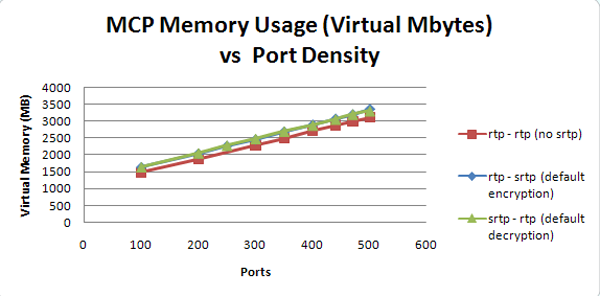
In Figure: MCP Memory Usage versus Port Density, in the video + audio test case, memory usage is causing the bottleneck. The graph depicts a comparison of virtual memory usage when default encryption, default decryption SRTP mode, and an RTP-only scenario is tested. All of these test case results approach the 3GB limit when ports reach 400. Even in the RTP-only test case, the virtual memory is only slightly lower. Therefore, 400 ports is considered peak capacity.
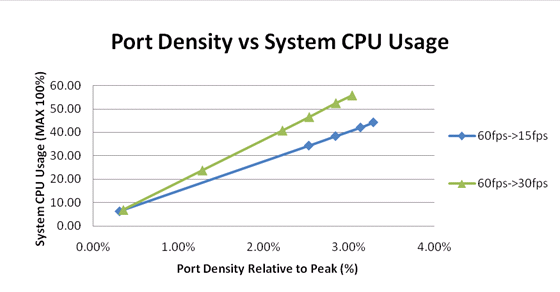
The graphs in Figure: System CPU Usage versus Port Density—Default Encryption, Decryption, Figure: System CPU Usage versus Port Density—Encryption, and Figure: System CPU Usage versus Port Density—Decryption provide comparisons of the system CPU usage in various encryption and decryption test case scenarios:

The SRTP/RTP test results suggest these conclusions:
- In the encryption scenario, the overall system CPU usage increased from 4.6% to 6.5%—a 41% increase at 400 ports.
- In the decryption scenario, the overall system CPU usage increased from 4.6% to 6.2%—a 35% increase at 400 ports.
- In the encryption scenario, the unencrypted and unauthenticated mode test cases indicates lower CPU usage than the default mode test cases—89% and 91% respectively at 400 ports.
In the decryption scenario, the unencrypted and unauthenticated mode test cases indicated lower CPU usage than the default mode test cases—85% and 92% respectively at 400 ports.
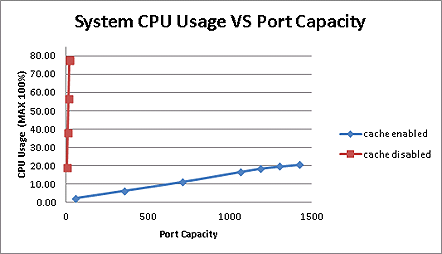
Play Cache
Enabling the play cache functionality increases overall capacity. The transcoding occurs just once during the first call. The transcoded contents is cached and reused in all subsequent calls, and resources normally used for transcoding are no longer needed.
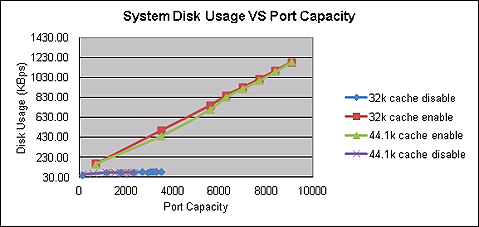
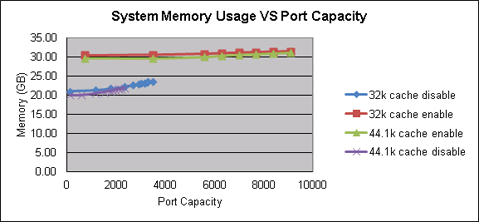
Figure: System CPU Usage vs. Port Capacity (audio-only), Figure: System Disk Usage vs. Port Capacity, and Figure: System Memory Usage vs. Port Capacity are graphs of data derived from MP3 file playback via MSML play:
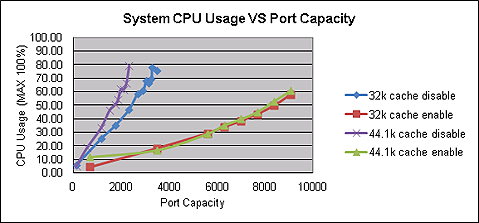
By storing and then accessing a transcoded codec, the play cache both conserves and expends system resources in a mostly positive trade-off.
Play Cache Enabled
Transcoding (and its strong demand on system capacity) occurs only during the first call; system performance improves noticeably on all subsequent calls.
The play cache consumes system memory when enabled, which increases disk traffic and affects system performance.
Play Cache Disabled
CPU usage is intensive during transcoding, which occurs for every call. System performance is noticeably affected.
Figure: System CPU Usage vs. Port Capacity (video and audio) (below) compares the results for transcoding video and audio with the play cache enabled and disabled. The video stream is transcoded from 720p (30fps, 4Mbps, High profile and level 3) to CIF (Main profile and level 2). The audio is AMR. The source file is 3gp. Note that capacity is even further impacted than with audio-only.
Conference Performance
In the following conference use cases, three variables affect Media Control Platform performance:
- The number of simultaneous conferences.
- The number of participants per conference.
- The number of speaking participants.
As the graph Figure: CPU Usage Versus Total Number of Participants illustrates, the variable impacting performance the most is the total number of participants hosted by GVP (the number of conferences multiplied by the number of participants per conference).
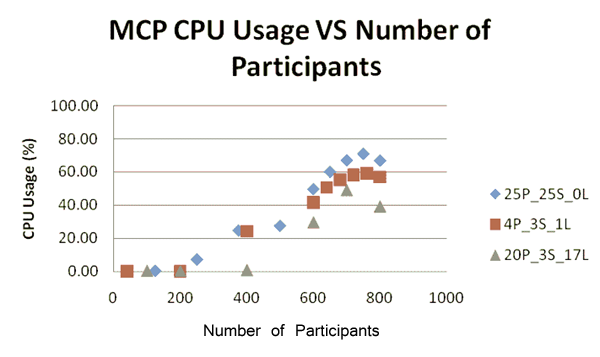
The symbols and legend in the graph in Figure: CPU Usage Versus Total Number of Participants are explained below:
- 25P_25S_0L = 25 participants per conference (25 active speakers + 0 listen only)
- 4P_3S_1L = 4 participants per conference (3 active speakers + 1 listen only)
- 20P_3S_17L = 20 participants per conference (3 active speakers + 17 listen only)
Overall, the CPU usage increases with a higher percentage of actively speaking participants. However, regardless of the conference configuration, the system bottleneck occurs when the total number of participants reaches ~600 (on a 2x Xeon5160 @3.0GHz server).
The test was conducted using pre-8.1.5 GVP versions (on a physical 2x Xeon5160 @3.0GHz server that NetAnn used to create and join the conference).
For GVP 8.1.5, there is no limit to the number of participants. Two types of testing were conducted: a conference with 32 participants and a conference with as unlimited participants. Both test types used MSML to create and join the conference.
The first test type (32 participants) used four VMs on vSphere 5.0 on 2x Xeon E5620 (8 cores). Each participant was an active speaker for five minutes (300 seconds). The higher number of participants (768 participants from 24 conferences of 32 participants each) was handled successfully. The overall system CPU usage was not as high as before, since the bottleneck was the call to join an MSML conference.
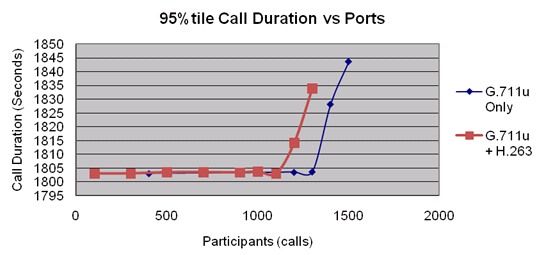
The second test used a physical machine—a Xeon X5675 @3.06GHz—since only one conference would be created. The testing was conducted with two types of codecs: G.711u audio-only and H.263 video (video switching) + G.711u audio. The newly introduced MCP parameter conference.threadedoutput had to be enabled (default off) for a larger conference, otherwise, MCP could not achieve such a high number of participants. There were only three active speakers in the conference while all other participants were listeners. Each participant would stay 30 minutes (1800 seconds) in the conference. The Figure: System CPU Usage vs. Participants (below) shows the overall system CPU usage:

Figure: 95th Percentile vs. Ports (below) shows that CPU usage jumps beyond 1100 participants for the G.711u-only case and beyond 900 participants for the G.711 + H.263 case; and that 48-hour load testing can survive 1300 participants for the G.711u-only case and 1100 participants for the G.711u + H.263 case. The ninety-fifth percentile of call duration shows that CPU usage would jump beyond 1300 participants for the G.711u-only case and beyond 1100 for the G.711u + H.263 case.
The graph below illustrates memory usage:
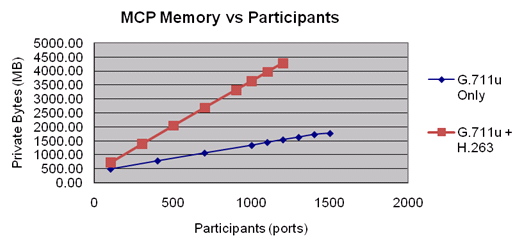
When tested on a 64-bit OS, memory usage for the G.711u + H.263 case exceeded 3GB virtual memory (2GB beyond 500 participants). This usage crashed a 32-bit OS. Thus, the peak capacity for G.711u + H.263 is 500.
HR Timer
Two parameters: HR Timer (specifically for Windows) and Gain Control, impact the performance of the conference. Figure: System CPU Usage vs. Capacity (hr timer - gain) (below) compares the performance in terms of system CPU usage from combinations of different values of these two parameters:
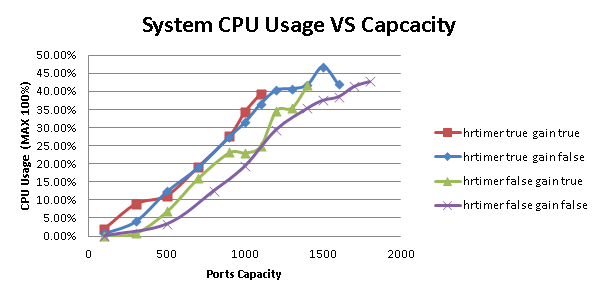
The highest port capacity (measured in Participants) with the least CPU usage can be achieved when both HR Timer and gain control are turned OFF. Conversely, the lowest port capacity with the highest CPU usage is achieved when both parameters are turned ON. Table: Port Capacity (measured in participants) below documents these results.
| Gain Control | HR Timer | Participants |
|---|---|---|
| ON | ON | 1000 |
| OFF | ON | 1300 |
| ON | OFF | 1400 |
| OFF | OFF | 1800 |
Prior to 8.1.6, gain control was hard-coded to turned on and there was no HR timer. So in 8.1.6, gain control on and HR time off was compatible with previous releases.
MSML CPA/CPD Performance
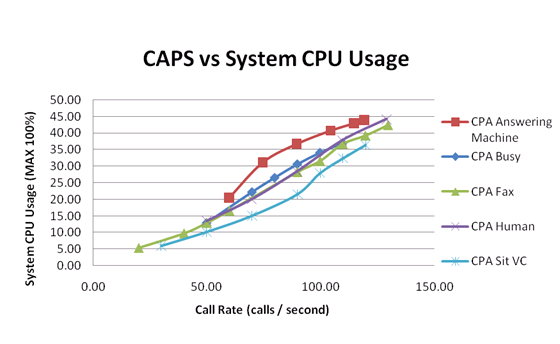
CPA/CPD is requested through MSML; therefore performance is measured by call rate. Testing was conducted with different tones such as Answering Machine, Busy, Fax, Human, and SIT VC. Below is a graph for all of the above tones:
The call duration varies, depending upon the type of tone and the length of recognition, and the peak call rates are quite close one another for each tone. In other words, call rate—and not ports—is a major factor determining peak capacity.