Contents
Templates
WFM Forecast templates help you create forecasts for sites or business units that have little or no historical data. In addition, there are other uses for templates. For example, you can create templates for service requirements, such as average speed of answer (ASA), and service level (SL). In those cases, forecast templates are used to apply different values for different periods of the day, instead of using a single value for the whole day.
Use the Forecast templates features to:
- Select and manage forecast templates.
- Edit template values and settings.
- View template values in a graph.
- Add or remove activities within templates.
- Create templates.
- Create templates based on existing data.
When creating templates, you can copy and paste data between a grid and a spreadsheet. For example, you can copy and paste from a Scenario Volumes view or Scenario Staffing view.
Opening the Templates view
You create, edit, filter, and delete forecast templates in WFM's Forecast module, by selecting Forecast > Templates.
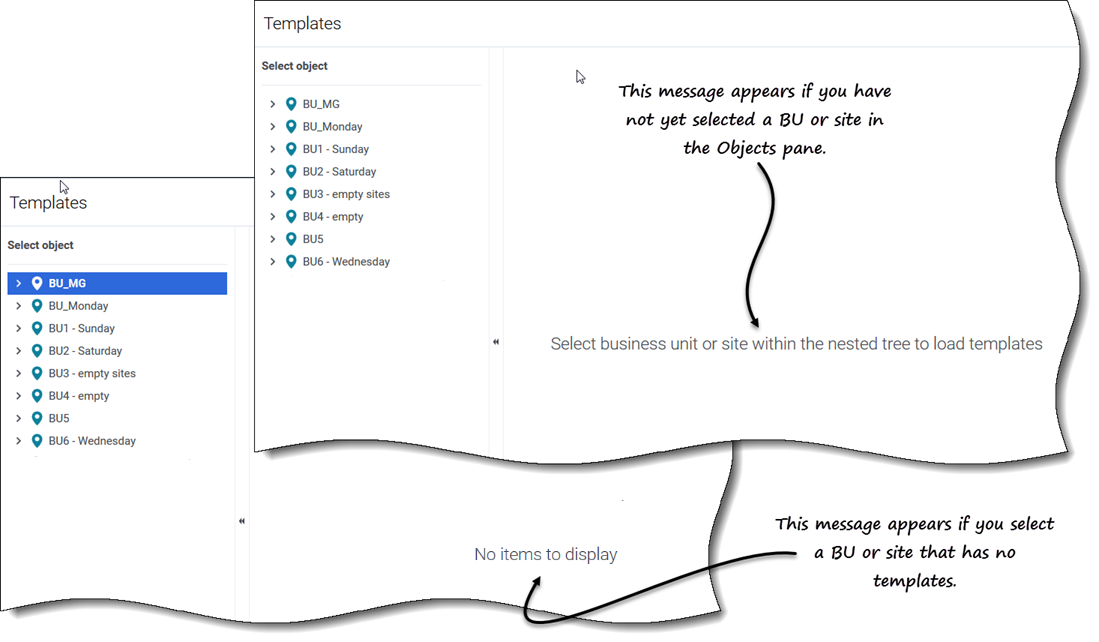
When you open this view initially, you might not see any templates listed (see figure). WFM displays a list of associated templates only after you select a business unit or site in the Objects pane.
If no templates exist for the selected object, you'll see the message No items to display. Either create a template for the selected object or choose another object to view it's templates.
Working in the Templates view
The Templates view is split into three panes.
The Objects pane displays a hierarchical list of business units and sites in the enterprise. In this pane:
- Select a business unit or site (by clicking the arrow > beside the business unit) to see a list of templates for the selected object.
The Templates pane displays the name of the selected business unit or site and a table containing its templates. In this pane:
- Select an template to display its tabs in the Data pane.
- Create a template. Click New template in the toolbar.
- If there are no templates for the selected object, the message No items to display appears in the middle of the pane.
- Delete templates. Check the boxes to select one or more templates and click Delete in the toolbar.
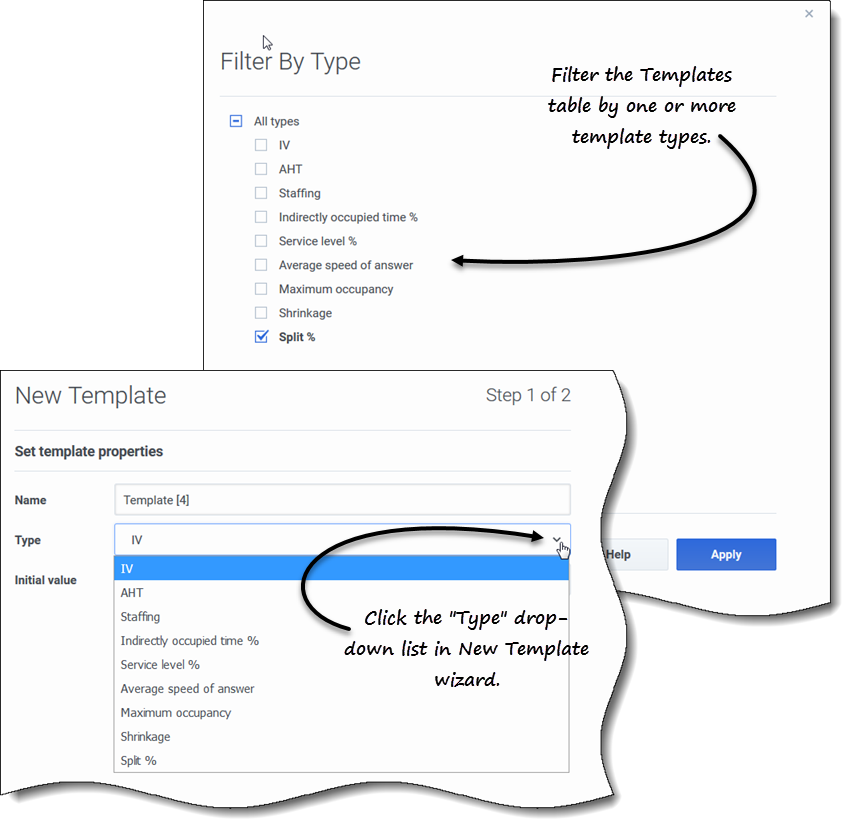
 Filter the list of templates to display only the template types you want to see.
- Use the paging controls to navigate through lists of templates that are more than one page long.
The Data pane displays three tabs: Properties, Distribution, and Activities. In this pane:
- View the settings and controls for any of the three tabs, or change their settings.
- The tab settings are described below.
Understanding the template's data
The template data can be viewed and edited by using the following three tabs:
Properties tab
The Properties tab contains two fields:
- Name—The name of the forecast template.
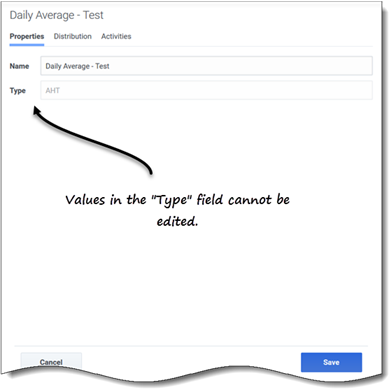
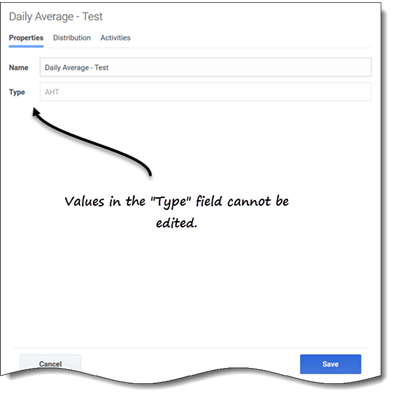
- Type—The template type. You choose the template type when you are creating templates. You cannot edit this field.
The Name field is editable. Simply enter the new name and click Save.
Distribution tab
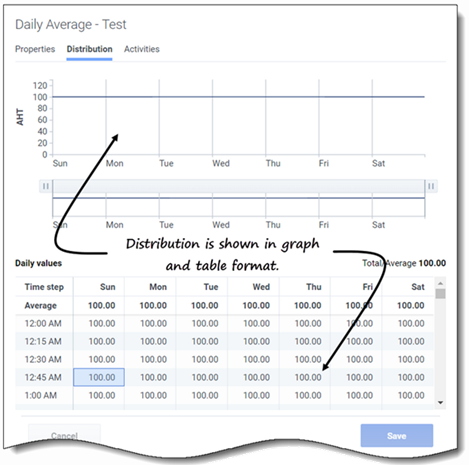
The Distribution tab displays a forecast template's values for a 7-day period in both graphical and table format.
To adjust the graph's displayed time interval, use the horizontal sliders.
The graph adjusts to display only the selected days (to a minimum of 1 day) and divides them into timesteps, according to the number of days that are displayed.
In the grid, use the vertical scroll bar to see the following columns and rows:
- The Time step column is divided into 15-minute timesteps.
- The remaining columns show the days of the week.
- The top row shows is either the Total or Average daily value for each day of the week, depending on the template type you've selected.
- The Total/Average daily value is displayed to the far right, above the table.
This cells in the grid are editable. Simply enter new values and click Save.
Activities tab
The Activities tab displays the activities associated with a forecast template in a hierarchical format.
Clicking the top-most check box selects all of the site's activities.
Activities selection is editable in this tab. Simply select or deselect one or more check boxes and click Save.
Selecting a template type
You select the template type when you are creating templates. Be sure to use acceptable values for each type.
You can filter the Templates grid by the following template types:
- IV—Represents interaction volumes by the number of interactions per timestep.
- When you save historical IV or AHT for a multi-site activity as a template, only multi-site activity data are saved, never the sum of underlying activities.
- AHT—Represents the average handle time, in seconds. See the IV description above.
- Staffing—Represented as the number of agents (full-time equivalents) to be scheduled for each timestep.
- This can be either calculated by WFM (Calculated Staffing) or set by the user (Required Staffing), or you can use both Calculated and Required values in a forecast. See Tip.
- Indirectly occupied time %—Represented as a percentage. See Tip.
- Service level %—Represented as a percentage. See Tip.
- Average speed of answer—Represented in seconds. See Tip.
- Maximum occupancy—Represents the agent's maximum occupied time, as a percentage.
- Shrinkage—Represents the amount of shrinkage or overhead, as a percentage.
- Split %—Represents how multi-site activities are split, as a percentage.
Acceptable range of values in templates
| Template type | Acceptable values |
|---|---|
| Interaction volumes (IV) | 0 to 999999999 |
| Average handle time (AHT) | 0.00 to 999999999.99 |
| Staffing | 0 to 999999999 |
| Indirectly occupied time % | 0.01 to 99.99 |
| Service level % | 0.01 to 100 |
| Average speed of answer (ASA) | 0.01 to 999999999.99 |
| Maximum occupancy % | 0.01 to 100 |
| Shrinkage % | 0.00 to 99.99 |
| Split % | 0.00 to 100.00 |

