Contents
Overlays
In WFM, using overlays (previously named factors) enable you to factor in and track events that might affect interaction volumes. Each event in an overlay represents an abnormality in historical data or in the future—that is, a fluctuation in interaction volumes (IV) or average handling time (AHT) that is not a usual seasonal, intra-week, or intra-day trend. Events that point to the same kind of abnormality, one that has happened multiple times in the past or can happen in the future, can be arranged into groups that are simply called overlays. The most common overlay examples are sales promotions, advertising campaigns, and catalog drops.
Impact of overlay events on prediction data
It's important to understand the impact that overlays events make on prediction data. A forecast's prediction data is directly impacted when a specific overlay event occurs over a prediction interval. WFM uses one of two calculations to determine an overlay's impact on prediction data:
- Multiplicative—Increase (or decrease) every step of predicted data by a percentage. The percentage is defined by overlay impact distribution, multiplied by the strength of the event. The duration of the interval is affected by event changes.
- Overriding—Re-distribute (but does not change) the volume of an event's interval. The total volume does not change, but it might be moved from one event-step to another.
For more information about overlay types and examples, see the Overlays Primer in the Workforce Management Administrator's Guide.
Opening the Overlays view
You create, edit, and delete overlays in WFM's Forecast module, by selecting Forecast > Overlays.
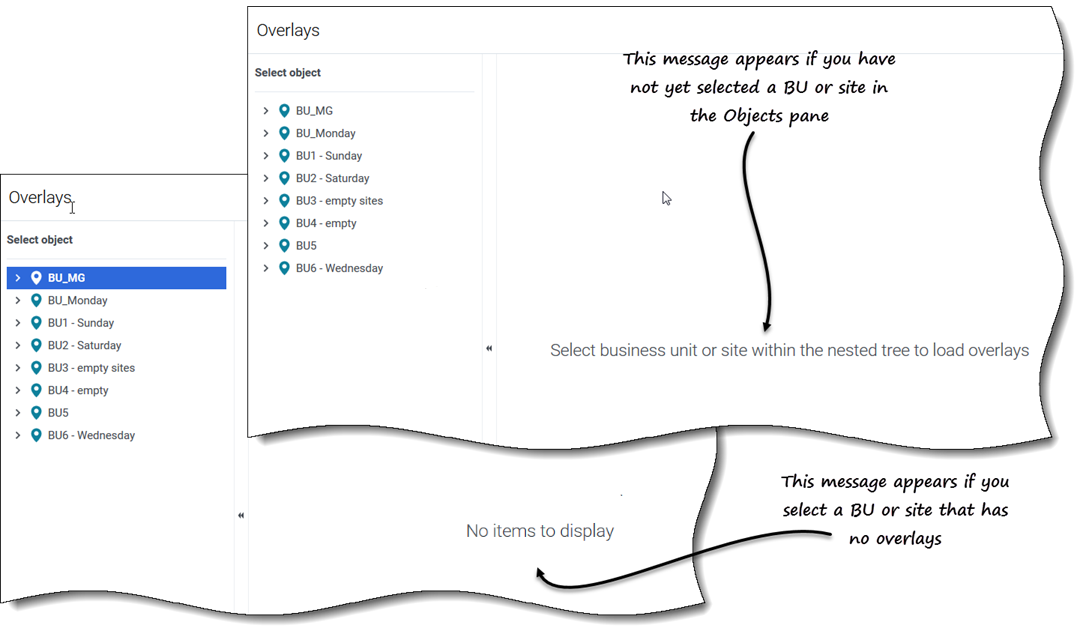
When you open this view initially, you might not see any overlays listed (see figure). WFM displays a list of associated overlays only after you select a business unit or site in the Objects pane. If no overlays exist for the selected object, you'll see the message No items to display. Either create an overlay for the selected object or choose another object to view it's overlays.
Working in the Overlays view
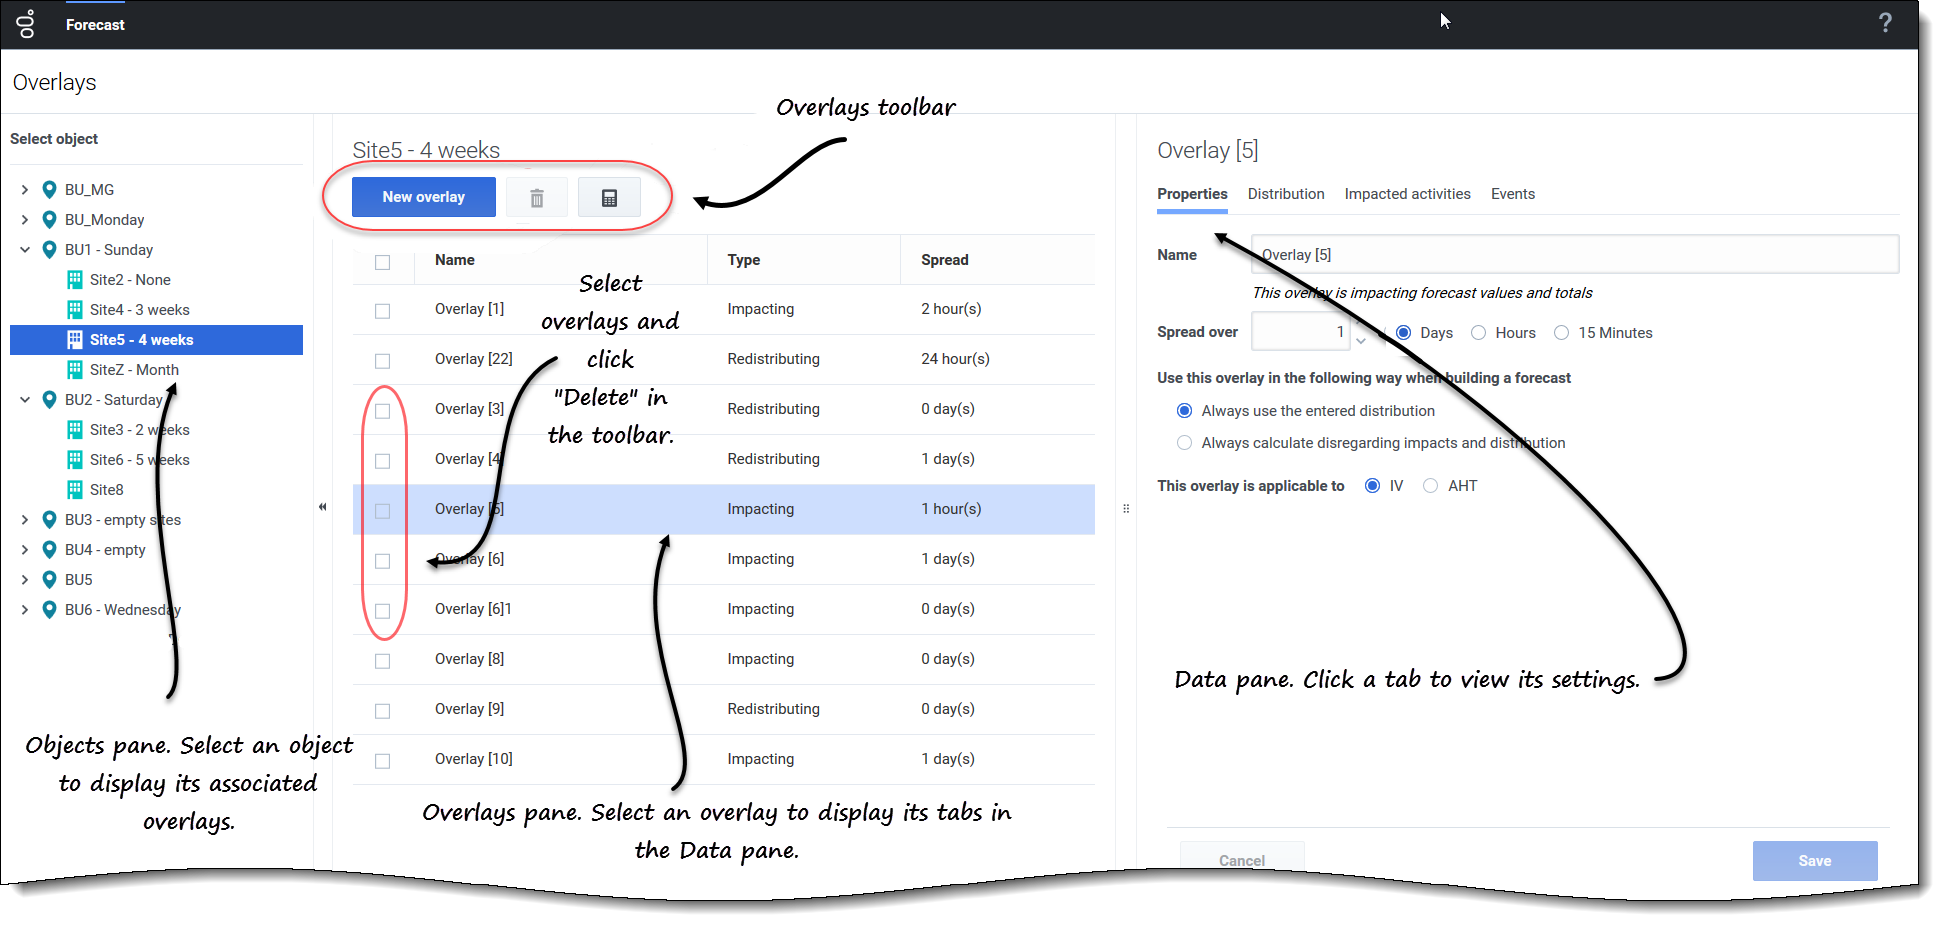
The Overlays view is split into three panes:
- Objects pane—Displays a hierarchical list of business units and sites in the enterprise. In this pane:
- Select a business unit or site (by clicking the arrow > beside the business unit) to see a list of overlays for the selected object.
- Overlays pane—Displays the name of the selected business unit or site and a table containing its overlays. In this pane:
- Select an overlay by type (Impacting or Redistributing) to display the tabs in the Data pane.
- Create an overlay, click New overlay in the toolbar.
- If there are no overlays for the selected object, the message No items to display appears in the middle of the pane.
- Delete overlays, check the boxes to select one or more overlays and click Delete in the toolbar.
- Data pane—Displays four tabs for the selected overlay: Properties, Distribution, Impacted activities, and Events. In this pane:
- View or change the settings in any of these tabs.
- The tab settings are described below.
- View or change the settings in any of these tabs.
Understanding the overlay's data
When you select an overlay in the Overlays pane, the four tabs associated with the overlay display in the Data pane. Click the Properties, Distribution, Impacted activities, or Events tab to display the settings described in this topic.
Properties tab
The Properties tab settings and controls are described as follows:
- Name field—You can edit the name in this field.
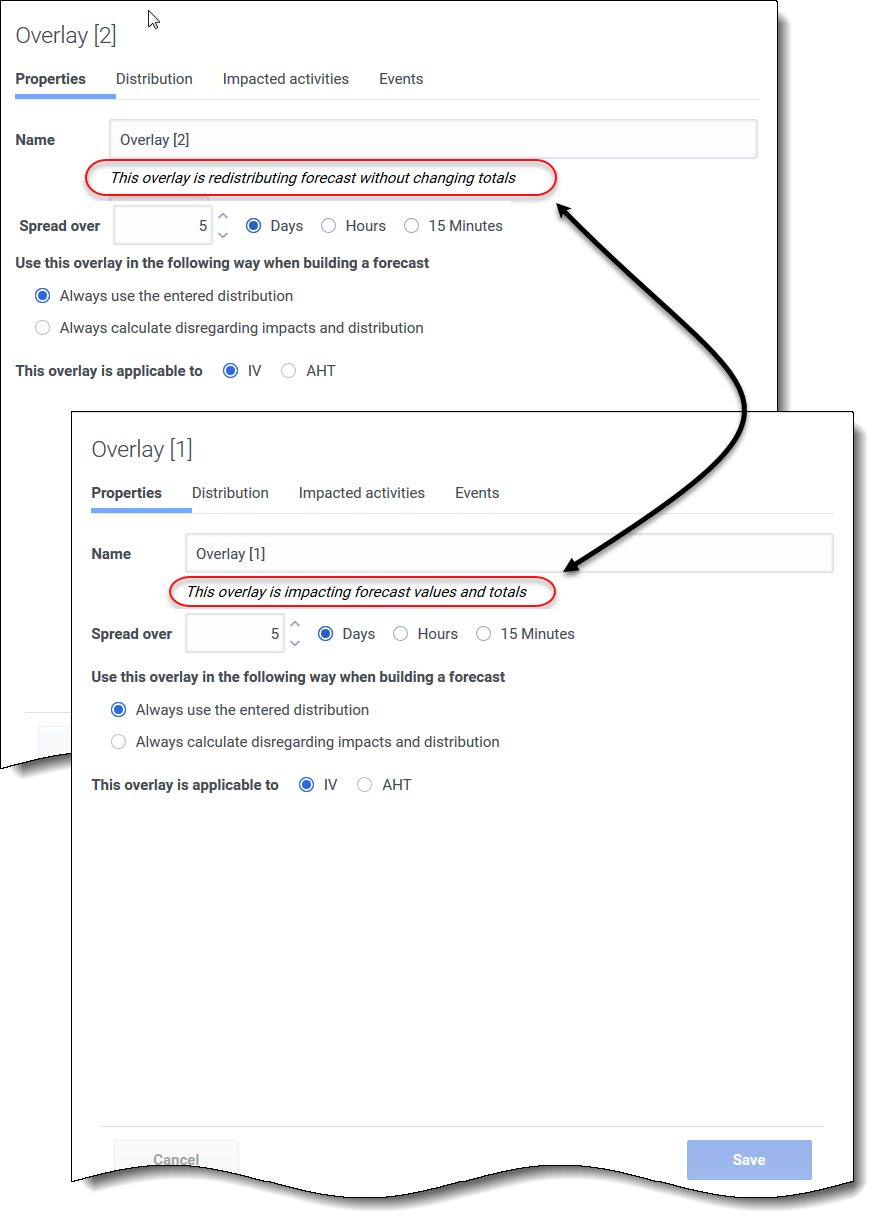
- This overlay is label—You'll see one of the following labels just below the Name field, depending on the settings you chose when you created the overlay:
- This overlay is impacting forecast values and totals—Specify that this overlay can impact the forecast by changing forecast’s values and totals. This option is the default.
- This overlay is redistributing forecast without changing totals—Specify that this overlay must preserve a forecast’s total for specific period even while changing the distribution of values inside that period.
- Spread over field—Displays the length of time that the selected Overlay will occupy. Edit this field and select the Days, Hours, or 15 Minutes radio button. The value must be greater than 0 (zero) and the default is set during creation.
- Use this overlay in the following way when building a forecast radio button group—One of these two settings will be selected:
- Always use entered distribution—Use the specified (entered) distribution when building a forecast. This option enables the Distribution tab.
- Always calculate disregarding impacts and distribution—Use this overlay, but always disregard impacts and distribution when building a forecast. This option disables the Distribution tab.
- This overlay is applicable to radio button group—One of the following settings will be selected:
- IV—Specify that this overlay applies only to Interaction Volume (IV).
- AHT—Specify that this overlay applies only to Average Handling Time (AHT).
Distribution tab
The settings you see on the Distribution tab depend on the choices you made in step 1 of the New Overlay wizard or in the overlay's Properties tab. Specifically, this tab is disabled if Always calculate disregarding impacts and distribution was selected in either place.
If you selected Always use the entered distribution when creating the overlay:
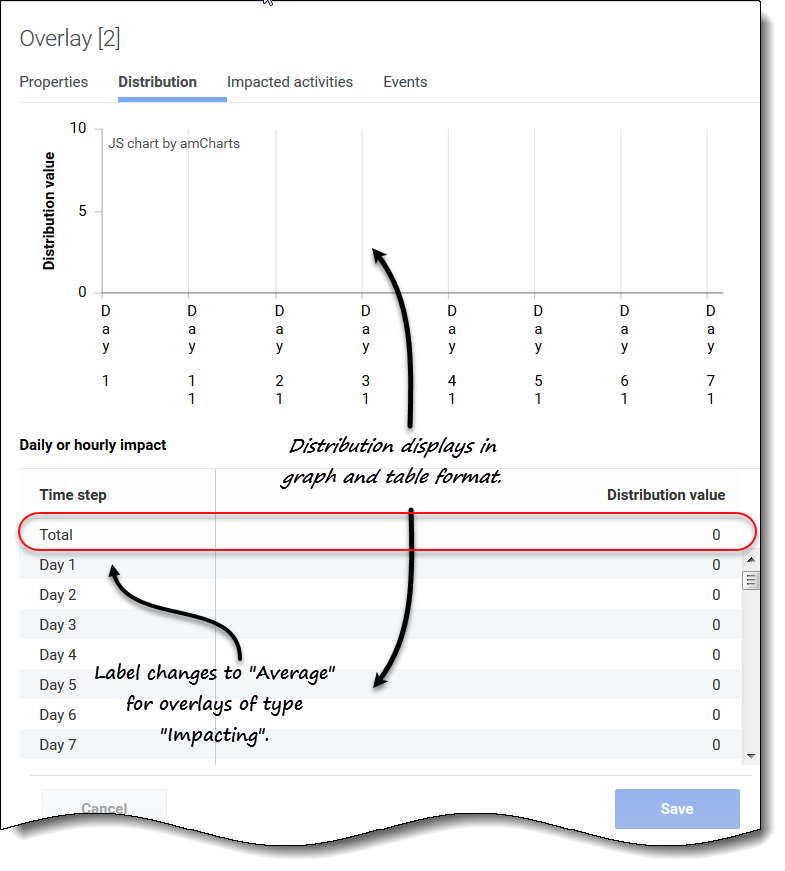
- Graph—Displays the same information as the grid below it displays, but in graphical form.
- Grid—Displays and allows you to edit the overlay's distribution. It contains the following columns in the Daily or hourly impact section:
- Timestep—Each row displays an increment during which the overlay will be in effect. The actual increment (timestep, day, or hour) is set in Properties tab.
- Distribution value—Displays the distribution value of each increment. The default value in each cell is 0.
- If the overlay is of the type:
- Impacting—You can enter values from -100 to 9999 into the grid. The top-most row in the shows the Average value of all timesteps.
- Redistributing—You can enter a percentage into the grid from 0 to 100. The top-most row in the grid shows the Total value of all timesteps.
- If the Total does not equal 100 %, you will see a warning and will not be able to save your changes to the overlay.
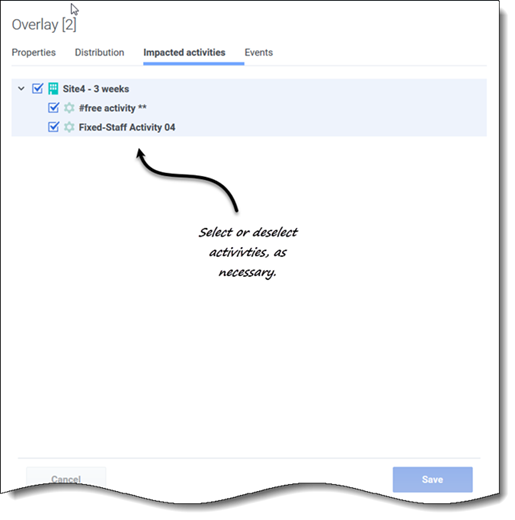
Impacted activities tab
This tab lists all activities that correspond to the business unit or site that was selected in the Object pane.
- Select one or more activities that will be impacted by the selected factor.
- Clear all check boxes to specify no impact.
Events tab
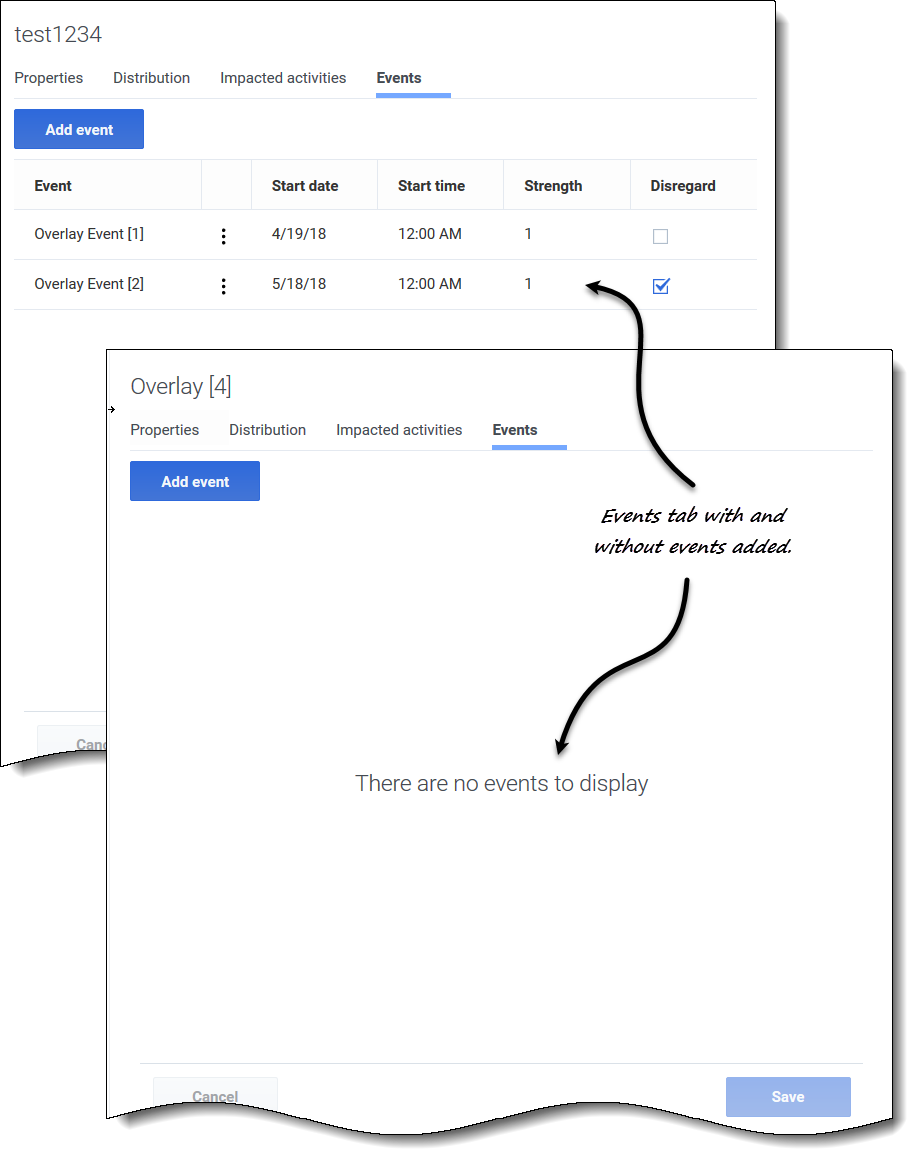
If there are no events for the selected overlay, you'll see only the Add events button and the message There are no events to display. If events have been added, you'll see a grid listing all events for the overlay, one per row. You can edit the value in every cell of this grid by clicking Actions > Edit.
The grid includes the following columns:
- Event—The name of the event.
 Actions icon—Clicking this icon opens a drop-down menu containing two actions for selection: Edit and Delete.
- Start date—The start date of the event.
- Start time—The start time of the event.
- Strength—A coefficient (or multiplier) that measures the final impact of an event. The range is any positive value (greater than zero), up to nine digits and two decimals.
- Disregard—If the check box is checked, the event disregards historical data. If unchecked historical data is considered. See Ignoring historical data.
The Events tab includes the following controls:
- Add event button—Click to add an event.
- Cancel button—Click to cancel and discard changes.
- Save button—Click to save changes.
Ignoring historical data in overlays
Any event under an overlay type may have the Ignore Historical Data flag set, which specifies whether the historical-data interval data that is covered by that event is used in calculations of volume prediction or overlay impact (see Calculating Overlay Impact).
If an event does not have the Ignore Historical Data flag set, then the data that is covered by the event is considered for prediction. There is no additional processing of historical data that is affected by the event, other than ignoring it or using it.
Calculating an overlay's impact
The impact of an overlay is determined by analyzing historical data and by using WFM's prediction algorithm. The algorithm analyzes the period of historical data, which contains one or more events of overlay that are to be calculated.
Overlays can be precalculated before starting volume forecasting or during volume forecasting (see "Event Impact Distribution" in the Workforce Management Administrator's Guide). Given the same historical data and using the same method, the results should be identical.
Multiplicative overlays are calculated by separating the seasonal component (yearly, daily, or intra-day) from the event impact for each event of the overlay in the given historical data. Then, the impact is divided by event strength and averaged. When the impact is applied to an event on the prediction interval, it is multiplied by the strength of that event.
In Overriding Overlay, the percentage of each event-step in the total of the whole event period is calculated for each event, and then averaged. See the following example:
A historical period has two events in a daily overlay, which is 3 days long. The days of the first event are 150, 200, 150 (30%, 40%, and 30% of the total, respectively), and the days of the second event are 150, 150, 200 (30%, 30%, and 40% of the total, respectively). Each event-step (in this case, a day) is averaged individually, and the overlay is calculated as 30%, 35%, 35%, respectively.

