
Installing the Web Engagement Reporting Server
Starting with release 8.5.000.26, Web Engagement uses Genesys Data Processing Server for reporting. You must only use Web Engagement Reporting Server if you are running an earlier release.
Note: Because many of the procedures involved in configuring the Reporting Server are similar to the ones you have used to configure Web Engagement Server, you may want to consult Installing the Genesys Web Engagement Server while you are configuring Reporting Server.
Important: Genesys recommends that you use a dedicated Cassandra data center for reporting purposes. This will minimize the risk of Cassandra-related faults in operational environments that are running under a heavy load.
Before You Begin
Because Web Engagement Reporting Server must process a lot of data, it needs to run on top of a high-speed—and highly scalable—cluster computing system. Genesys has chosen Apache Spark for this task.
Spark supports several types of clustering. Fortunately, Reporting Server works well with the simplest one, Spark Standalone Mode. This mode provides high availability by using a dedicated master node. A typical cluster deployment will consist of one master node and several worker nodes and is usually started by Reporting Server in the background.
Genesys recommends that you configure Reporting Server in Genesys Administrator Extensions (GAX), defining a single Application Cluster object and the appropriate number of individual node objects. You can configure these objects and their options using the procedures provided on the rest of this page.
Reporting Server Nodes
As we just mentioned, the Spark cluster consists of one master node and several worker nodes. Any Reporting Server node can be the master node in the cluster, as this role is defined by the value of the Spark startMode option in the node's configuration options. Here is more information about the two types of node:
- The Master node is represented by a Spark start mode of both, which indicates that both a Spark Master and a Spark Worker instance will be started on the node. Please note that the Spark host option should be set in agreement with start mode so that the hostname used in the Spark host setting belongs to the node that runs the Spark Master instance. To avoid problems with connectivity inside the Spark Cluster, this hostname should be the primary one in the network configuration for this host. In other words, Java's InetAddress.getLocalHost should return the same value for the Reporting Server Master node.
- The Worker node is represented by a start mode of worker. Only a Spark worker instance will be launched at this node.
There is one additional mode available for the Spark start mode option. A mode of off means that no Spark processes will be launched on this host and that the role of the node in the Reporting Server cluster is undefined. This mode is for use in situations where you want to have an externally managed Spark cluster, and limits you to one Reporting Server node, which serves as an entry point for the Spark cluster. You cannot deploy Reporting Server with multiple nodes if you have set the start mode to off. Also, if you use this mode, you must have an advanced understanding of how to work with and manage a Spark cluster.
Recommended Versions
Genesys recommends that you use specific Web Engagement Reporting Server and Web Engagement Server versions together, as shown in the following table:
| Web Engagement Reporting Server | Web Engagement Server |
|---|---|
| 8.5.000.14 | 8.5.000.14 |
| 8.5.000.17 | 8.5.000.15 |
Configuring Reporting Server
We have included information about Reporting Server–related configuration options at the end of this page.
Deploying the Web Engagement Reporting Server
To deploy Reporting Server, follow these steps:
- Importing the Reporting Server Cluster Template
- Creating the Cluster Application
- Configuring the Cluster Application
- Importing the Reporting Server Template
- Creating a Node Application
- Configuring a Node Application
- Tuning analytical Cassandra nodes to skip indexing
- Adding Nodes to a Cluster
- Updating the Web Engagement Cluster Application
- Reporting Server Data Storage
- Installing the Reporting Server
- Installing Dashboards and Widgets into Pulse
- Deploying and Scheduling Job Packages
- Web Engagement Reporting Data Flow
Note: For more information on how to work with templates and application objects in Genesys Administrator, consult Generic Configuration Procedures.
Importing the Reporting Server Cluster Template
Note: For more information on how to work with templates in Genesys Administrator, consult Generic Configuration Procedures.
Start
- Open Genesys Administrator and navigate to Provisioning > Environment > Application Templates.
- In the Tasks panel, click Upload Template.
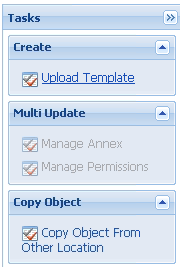 Upload Template link in the Tasks panel
 - In the Click 'Add' and choose application template (APD) file to import window, click Add.
- Browse to the Reporting_Server_Cluster.apd file. The New Application Template panel opens.
- Click Save & Close.

End
Creating the Cluster Application
Note: For more information on how to work with application objects in Genesys Administrator, consult Generic Configuration Procedures.
Prerequisites
- You completed Importing the Reporting Server Cluster Template.
Start
- Open Genesys Administrator and navigate to Provisioning > Environment > Applications.
- In the Tasks panel, click Create New Application.
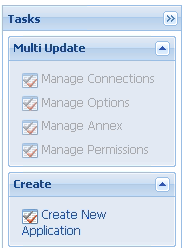 Create New Application link.
 - In the Select Application Template panel, click Browse for Template and select the Reporting Server Cluster template that you imported in Importing the Reporting Server Cluster Template. Click OK.
- The template is added to the Select Application Template panel. Click Next.
- In the Select Metadata file panel, click Browse and select the Reporting_Server_Cluster.xml file. Click Open.
- The metadata file is added to the Select Metadata file panel. Click Next.
- In the Specify Application parameters tab:
- Enter a name for your application. For instance, Reporting_Server_Cluster.
- Make sure State is enabled.
- Select the Host on which the Reporting Server Cluster will reside.
- Click Create.
- The Results panel opens.
- Enable Opens the Application details form after clicking 'Finish' and click Finish. The Reporting Server Cluster application form opens and you can start configuring the Reporting Server Cluster application.
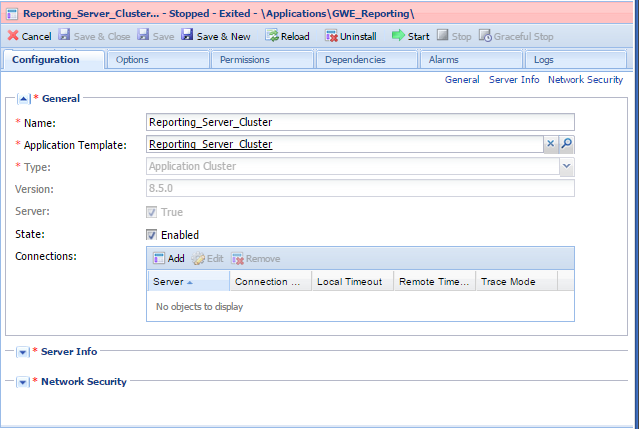 Reporting Server Cluster app opened in Genesys Administrator.


End
Configuring the Cluster Application
Note: For more information on how to work with application objects in Genesys Administrator, consult Generic Configuration Procedures.
Prerequisites
- You completed Creating the Cluster Application.
Start
- If your Cluster application form is not open in Genesys Administrator, navigate to Provisioning > Environment > Applications. Select the application defined for the Reporting Server Cluster and click Edit....
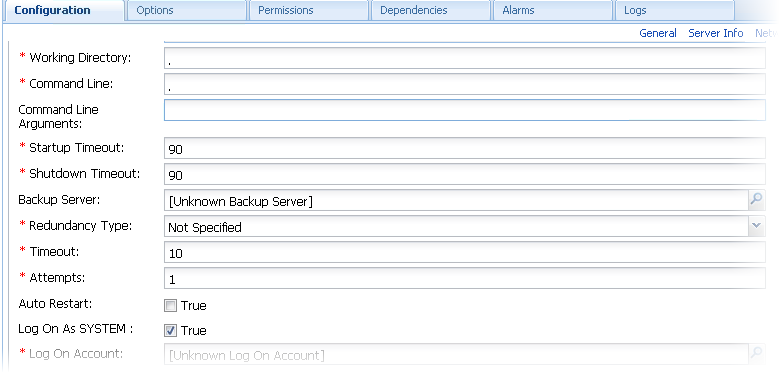
- Expand the Server Info pane.
- If your Host is not defined, click the lookup icon to browse to the hostname of your application.
- Ensure the Working Directory and Command Line fields contain "." (period).
 Commands
 - Click Save.
- In the Listening Ports section, create the default port by clicking Add. The Port Info dialog opens.
- Enter the Port. For instance, 10081.
- Choose http for the Connection Protocol.
- Click OK. The HTTP port with the default identifier appears in the list of Listening ports.
- To configure Embedded Cassandra, select the Options tab.
- Make sure that the value of the clusterName option in the [cassandraEmbedded] section of the Reporting Server Cluster application is the same as the value of the clusterName option in the Web Engagement Cluster application.
- In the [cassandraEmbedded] section, you can take the default values for all of the options except seedNodes, which requires a comma-separated list of seed nodes, where each seed node is represented by an IP address or fully qualified domain name (FQDN). For example:
- 192.168.0.1,192.168.0.3
- host1.mydomain.com,host2.mydomain.com.
- Important: The list of seed nodes should include at least one node from each operational and analytical data center.
- In the [cassandraKeyspace] section, you may need to tune the replicationStrategyParams option, which by default is set to 'AnalyticalDC':1. This value indicates a replication factor of 1 for nodes that belong to the AnalyticalDC data center. Note that the data center name is important for multi–data center configurations. When using the default endpoint snitch (GossipingPropertyFileSnitch), you can specify the data center name in Reporting Server installation folder/resources/cassandra-rackdc.properties. For more information, refer to http://docs.datastax.com/en/cassandra/2.2/cassandra/architecture/archsnitchGossipPF.html.
- Make sure that the value of the name option in the [cassandraKeyspace] section of the Reporting Server Cluster application is the same as the value of the name option in the Web Engagement Cluster application.
- To configure external Cassandra, follow the guidelines at Working with External Cassandra, applying the steps on that page to the Reporting Server Cluster instead of the Web Engagement Server Cluster.
- In the [spark] section, specify the value of the host option using the fully-qualified domain name (FQDN) or IP address for your Reporting Server.
Important: Spark is very sensitive about host names and sometimes even minor network configuration problems may result in cluster connectivity problems. The best way to ensure correct behavior is to verify that the spark.host option uses the same name as the Java InetAddress.getLocalHost().getHostName() method would return for this host. - Click Save & Close. If the Confirmation dialog opens, click Yes.

End
Importing the Reporting Server Template
Prerequisites
- You completed Configuring the Cluster Application.
Start
- Open Genesys Administrator and navigate to Provisioning > Environment > Application Templates.
- In the Tasks panel, click Upload Template. Upload Template link in the Tasks panel
- In the Click 'Add' and choose application template (APD) file to import window, click Add.
- Browse to the Reporting_Server.apd file and select it. The New Application Template panel opens.
- Click Save & Close.
End
Creating a Node Application
Prerequisites
- You completed Importing the Reporting Server Template.
Start
- Open Genesys Administrator and navigate to Provisioning > Environment > Applications.
- In the Tasks panel, click Create New Application. Create New Application link.
- In the Select Application Template panel, click Browse for Template and select the Reporting Server template that you imported in Importing the Reporting Server Template. Click OK.
- The template is added to the Select Application Template panel. Click Next.
- In the Select Metadata file panel, click Browse and select the Reporting_Server.xml file. Click Open.
- The metadata file is added to the Select Metadata file panel. Click Next.
- In Specify Application parameters:
- Enter a name for your application. For instance, Reporting_Server.
- Make sure State is enabled.
- Select the Host on which the node will reside.
- Click Create.
- The Results panel opens.
- Click Save & Close. If the Confirmation dialog opens, click Yes.
- Enable Opens the Application details form after clicking 'Finish' and click Finish. The Reporting_Server application form opens and you can start configuring the node application.
 Node app opened in Genesys Administrator.

End
Configuring a Node Application
Prerequisites
- You completed Creating a Node Application.
Start
- If your node application form is not open in Genesys Administrator, navigate to Provisioning > Environment > Applications. Select the application defined for the node and click Edit....
- In the Connections section of the Configuration tab, click Add. The Browse for applications panel opens. Select the Reporting Server Cluster application you defined above, then click OK. Node connection to Cluster
- Expand the Server Info pane.
- If your Host is not defined, click the lookup icon to browse to the hostname of your application.
- In the Listening Ports section, create the default port by clicking Add. The Port Info dialog opens.
- Enter the Port. For instance, 10081.
- Choose http for the Connection Protocol.
- Click OK. The HTTP port with the default identifier appears in the list of Listening ports.
- Click Save.
- To configure Embedded Cassandra and Spark, select the Options tab.
- In the View field, select Advanced View (Options).
- In the [cassandraEmbedded] section, set the values for listenAddress and rpcAddress, using a fully qualified domain name or the appropriate IP address.
- In the [spark] section, set the value for startMode. If you are configuring a master node, set this value to both. For other nodes, set it to worker.
Note: You should only have one master node configured for your Reporting Server cluster. If you have a single-node cluster, then your single node must be configured as a master node.

End
Tuning analytical Cassandra nodes to skip indexing
For performance reasons, Web Engagement Server's operational Cassandra nodes use custom Cassandra indexes that rely on the services of Elasticsearch. However, the analytical Cassandra nodes used by Data Processing Server do not require those indexes, as all analytical reads of Cassandra tables are full scan reads. Because of this, Genesys recommends that these indexes be removed from your analytical nodes.
If you are using embedded Cassandra, Web Engagement will automatically avoid creating these indexes. But if you are using external Cassandra, you must carry out the following procedure to get rid of them.
Note: You must do these steps before you replicate the Cassandra data from your operational data centers.
Start
- Copy the required libraries to the Cassandra lib folder for each Cassandra node in your analytical data centers.
- Modify your Cassandra startup scripts to include the genesys-es-dummy system property
- On Windows, append the following line to bin/cassandra.in.bat:
set JAVA_OPTS=%JAVA_OPTS% -Dgenesys-es-dummy=true
- On Linux, append the following line to bin/cassandra.in.sh:
export JVM_OPTS="$JVM_OPTS -Dgenesys-es-dummy=true"
- On Windows, append the following line to bin/cassandra.in.bat:
End
Adding Nodes to a Cluster
To create more nodes:
Start
- Follow the instructions above for Creating a Node Application, but use a different name for the new node.
- Configure the new node application, as shown above, but point to a different port.
End
Updating the Web Engagement Cluster Application
Genesys recommends you to use a dedicated data center for reporting. In order to do this, you must do the following to the Web Engagement Cluster application:
- Modify the seedNodes option in the [cassandraEmbedded] section so that it is in sync with the seedNodes option in the Reporting Server Cluster application.
- Modify the replicationStrategyParams option in the [cassandraKeyspace] section so that it includes replication to the reporting data center. For example:
'OperationalDC':1,'AnalyticalDC':1Important: You only need to do this for the Web Engagement Cluster application. The Reporting Server Cluster application does not need to be replicated to the operational data center.
Reporting Server Data Storage
Reporting Server stores several types of information:
- Aggregated data results
- General configuration data
- Tenant-specific configuration data
- Default Pulse dashboards and widgets
- Meta-information
All of this information is stored in a database layer that is indexed by Elasticsearch. By default, you can access the reporting database layer via HTTP, using the URL of the correctly configured Load Balancer:
- For embedded Cassandra, the Load Balancer should redirect requests to the Web Engagement Server hosts on port 9200 (or the port ID you have specified in the http.port option of the [elasticsearch] section of the Web Engagement Cluster application).
- For external Cassandra, the Load Balancer should redirect requests to the Cassandra hosts on port 9200 (or the port ID you have specified in the http.port option of the [elasticsearch] section of the Web Engagement Cluster application).
We will refer to this URL as the Reporting Data URL. When you send your browser or HTTP client requests to the Reporting Data URL, you should receive HTTP Response 200.
Installing the Reporting Server
Install the Reporting Server on Windows or Linux.
Note: For more information on how to install apps that you have configured in Genesys Administrator, consult Generic Installation Procedures.
The Pulse Collector
Reporting Server uses data gathered by a Pulse Collector. This Pulse Collector must only be installed on one node in the Reporting Server cluster.
Although the procedures in the next section tell you how to set up your initial Pulse Collector installation, if you decide later that you want to install the Pulse Collector on a different node, you must follow these extra steps:
- Turn the collector off at the node it was originally installed on:
- Stop the node
- Set the PULSE_COLLECTOR_ENABLED variable in your setenv.bat or setenv.sh file to false
- Remove the pulse-collector.war file from the webapps folder
- Restart the node
- Turn the collector on at another node:
- Stop the node
- Set the PULSE_COLLECTOR_ENABLED variable in your setenv.bat or setenv.sh file to true
- Set the value of REPORTING_ES_URL—also in your setenv.bat or setenv.sh file—to the value of your Reporting Data URL
- Copy the pulse-collector.war file from the etc folder to the webapps folder
- Restart the node
Prerequisites
- Configuring a Node Application
- A supported JDK is installed. See Java Requirements for details.
- In your installation package, locate and double-click the setup.exe file. The Install Shield opens the welcome screen.
- Click Next. The Connection Parameters to the Configuration Server screen appears.
- Under Host, specify the host name and port number where Configuration Server is running. (This is the main "listening" port entered in the Server Info tab for Configuration Server.)
- Under User, enter the user name and password for logging on to Configuration Server.
- Click Next. The Select Application screen appears.
- Select the Reporting Server Application—that is, the Node app you created above—that you are installing. The Application Properties area shows the Type, Host, Working Directory, Command Line executable, and Command Line Arguments information previously entered in the Server Info and Start Info tabs of the selected Application object.
- Click Next. The Choose Destination Location screen appears.
- Under Destination Folder, keep the default value or browse for the desired installation location. Note that you probably do not want to use the Windows Program Files folder as your destination folder.
- Click Next. The Backup Configuration Server Parameters screen appears.
- If you have a backup Configuration Server, enter the Host name and Port.
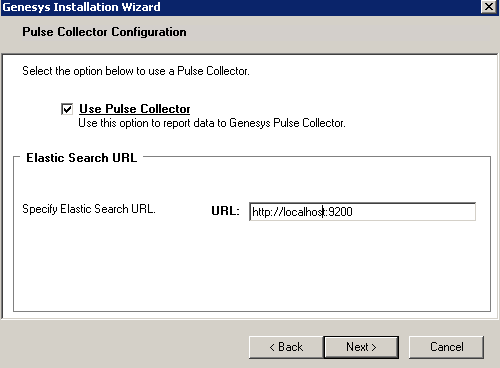
- In the Pulse Collector Configuration window, select Use Pulse Collector:
 Pulse Collector Configuration
 - In the resulting Elasticsearch URL field, specify the host and port of the Reporting Server cluster node on which you want to install the Pulse Collector. Note: You should only install the Pulse Collector on one node at a time, as mentioned above.
 Pulse Collector Host and Port
 - Click Next. Select the appropriate JDK:
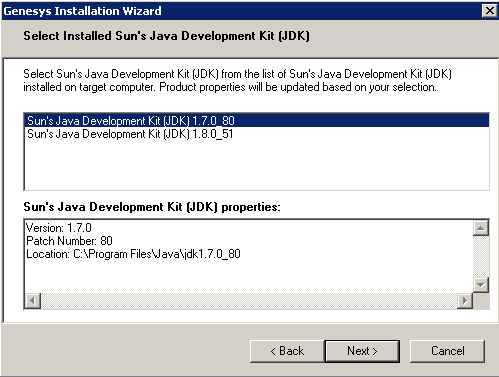 Select JDK
 - Click Next. The Ready to Install screen appears.
- Click Install. The Genesys Installation Wizard indicates it is performing the requested operation for Reporting Server. When through, the Installation Complete screen appears.
- Click Finish to complete your installation of the Reporting Server.
- Inspect the directory tree of your system to make sure that the files have been installed in the location that you intended.
- Apply the parameters to your Windows service.


Note: Genesys recommends that you frequently clear the Spark temporary directory—for example, once a week or before you start Reporting Server. You can find it in the system temporary directory with a name template of spark-*. The default location for this directory is system_disk:\Users\user_name\AppData\Local\Temp directory. You can also use the system disk clean-up procedure.
Prerequisites
- Configuring a Node Application
- A supported JDK is installed. See Java Requirements for details.
- Open a terminal in the Genesys Web Engagement CD/DVD or the Genesys Web Engagement IP, and run the Install.sh file. The Genesys Installation starts.
- Enter the hostname of the host on which you are going to install.
- Enter the connection information to log in to Configuration Server:
- The hostname. For instance, demosrv.genesyslab.com.
- The listening port. For instance, 2020.
- The user name. For instance, demo.
- The password.
- If you have a backup Configuration Server, enter the Host name and Port.
If the connection settings are successful, a list of keys and Web Engagement applications is displayed. - Enter the key for the Reporting Server application—that is, the Node app you created above in Configuration Server.
- Use the key for Genesys Pulse to indicate whether or not to enable the Pulse Collector
- If you have enabled the Pulse Collector, enter the Reporting Data Elasticsearch URL.
- Enter the location where Reporting Server is to be installed on your web server.
Note: This location must match the previous settings that you entered in Configuration Server. - If the installation is successful, the console displays the following message:
Installation of Web Engagement Reporting Server, version 8.5.x has completed successfully. - Inspect the directory tree of your system to make sure that the files have been installed in the location that you intended.
Note: Genesys recommends that you frequently clear the Spark temporary directory—for example, once a week or before you start Reporting Server. You can find it in the system temporary directory with a name template of spark-*. The default location for this directory is /tmp.
Installing Dashboards and Widgets into Pulse
Web Engagement comes with a configuration tool that is located in Web Engagement installation directory/tools/pulse. You can use this tool to install Web Engagement dashboards and widgets into Pulse in two different ways:
- Default Configuration—Only requires a few parameters that drive an automated configuration process
- Manual Configuration—Requires more extensive inputs, but provides more advanced configuration options
Prerequisites
- The enabled option in the [kibana] section of the Genesys Web Engagement cluster application is set to true.
- Web Engagement is running.
- The Reporting Data URL is accessible.
Default Configuration
Start
- Run the default configuration scenario with gdps-config-tool.jar:
- Go to Web Engagement installation directory/tools/pulse.
- Execute
java -jar gdps-config-tool.jar <Reporting Data URL> <gax_host> <gax_username> <gax_password> <Web Engagement Data URL>
Where <Web Engagement Data URL> is the address of the Load Balancer, which redirects requests to the Web Engagement Servers on the port specified by the port option in the [kibana] section of the Web Engagement Cluster application. For example:
java -jar gdps-config-tool.jar http://gwe-cluster-lb:9200 http://gax-host:8040 default password http://gwe-cluster-lb:5601
Note: <Web Engagement Data URL> is optional and can be skipped. If this URL is skipped, the Expanded Kibana View will be disabled. For example:java -jar gdps-config-tool.jar http://gwe-cluster-lb:9200 http://gax-host:8040 default password overwriteSystem
Note: The default scenario uses an index of gpe. To use a custom index name for your GWE tenant run gdps-config-tool.jar with -Dindex.name=Web_Engagement_keyspace_name, where Web_Engagement_keyspace_name is the value of the name option from the [cassandraKeyspace] section of the Web Engagement Cluster application. For example:
java -Dindex.name=gwekeyspace -jar gdps-config-tool.jar http://gwe-cluster-lb:9200 http://gax-host:8040 default password http://gwe-cluster-lb:5601
Note: By default, gdps-config-tool.jar creates a new system configuration when it is first run, but does not overwrite the system configuration if you run it again. To overwrite an existing system configuration, use the overwriteSystem flag. For example:
java -jar gdps-config-tool.jar http://gwe-cluster-lb:9200 http://gax-host:8040 default password http://gwe-cluster-lb:5601 overwriteSystem
- If the configuration process was successful, the console will display DONE.
Note: If an error has occurred, you can try to run the command again, as there are occasions when the configuration tool can't access an http resource, or when an http response times out. - Notify Reporting Server about the configuration changes using one of these methods:
- Send a GET request:
http://<Reporting Server Host>:<Reporting Server Port>/pulse‐collector/gdps/configuration/init
For example,
http://example.com:9999/pulse-collector/gdps/configuration/init
If the response is Collector has been re-initialized with new configuration, the new configuration was applied successfully.
- Reboot Reporting Server.
Note: You do not need to reboot GAX Server, Pulse, or Web Engagement Server after your Web Engagement–specific dashboards and widgets have been installed. All of the new widget templates, dashboards, and related elements will be added automatically.
- Send a GET request:
End
Manual Configuration
For manual configuration, run gdps-config-tool.jar with -Dindex.tool.mode=true.
For more information on how to do this, run java -Dindex.tool.mode=true -jar gdps-config-tool.jar.
Example 1
Export dashboards and configuration to the ./exported directory:
java -Dindex.tool.mode=true -Dworking.dir="./exported" -Des.import.config=true -jar gdps-config-tool.jar export gpe.kibana http://gwe-host-lb:9200Example 2
Import the collector configuration for a new tenant, in the newtenant keyspace:
Start
Create a JSON file with tenant-related configuration information in the ./config folder:
./config/gdps.collector-tenantConfiguration.json
{
  "tenantAliasName": "newtenant",
  "gaxUrl": "http://gaxurl:8040",
  "gaxUser": "gaxUser",
  "gaxPass": "gaxPass"
}
Import the new configuration:
java -Dindex.tool.mode=true -Dworking.dir="./config" -Des.import.config=true -jar gdps-config-tool.jar import newtenant http://gwe-host-lb:9200
Important: When you import configuration data from a folder, the configuration tool imports all of the JSON files that are contained in that folder. Make sure that your folder only contains the files you need.
Note: If you have changed Pulse-related configuration data in manual mode, you must remove your Pulse Web Engagement templates so that they can be recreated by Reporting Server. You can remove the Web Engagement Pulse templates by using the Add A Widget menu of any Pulse dashboard. Here is a list of the templates that you need to remove:
- GWE - Anonymous Vs Authenticated
- GWE - Conversions Funnel
- GWE - Mobile Vs Desktop
- GWE - New Vs Returning
- GWE - Rates
- GWE - Web Traffic Today
End
Deploying and Scheduling Job Packages
After you have installed and started the Reporting Server, you need to deploy and schedule jobs for it to process.
To do this, execute the following two scripts that are provided in Reporting Server Installation directory/deploy/gwe. You need to install CURL in order to use these scripts. Once you have installed it, make sure it's available from Reporting Server Installation directory/deploy/gwe, and run the following scripts:
- deploy-gwe.bat or deploy-gwe.sh deploys your jobs and requires the URL (host and port) for your Reporting Server.
- If the script executes successfully, you will receive the following response: {“status” : “Ok”}
- schedule-gwe.bat or schedule-gwe.sh schedules your jobs and requires:
- The URL (host and port) for your Reporting Server
- The Reporting Data URL
- The name of the Cassandra keyspace that is used by Web Engagement
Here is a sample command:
schedule-gwe.bat reporting-host:10081 gwe-cluster-lb:9200 gpe
In this sample, we can see that:
- Reporting Server is running on reporting-host at port 10081.
- The Load Balancer running on gwe-cluster-lb at port 9200 represents a Reporting Data URL.
- The GWE keyspace name is gpe.
If the script executes successfully, you will receive the following response: {"<schedule_guid>" : "Job scheduled"}
Web Engagement Reporting Data Flow
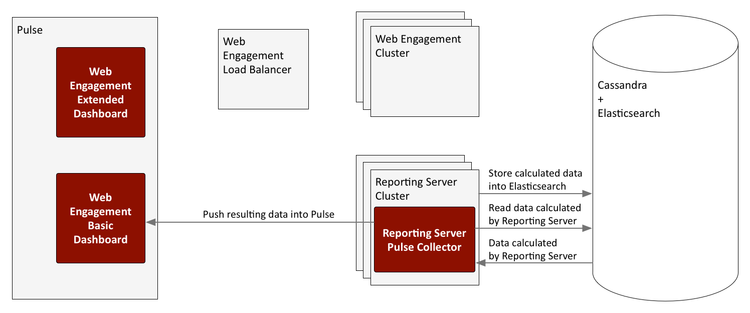
Web Engagement supports two types of Pulse reporting:
- The basic views, also known as the basic dashboards, are native Pulse widgets that are driven by a Pulse collector which is included with the Reporting Server. These widgets can be used in other dashboard views created in Pulse.
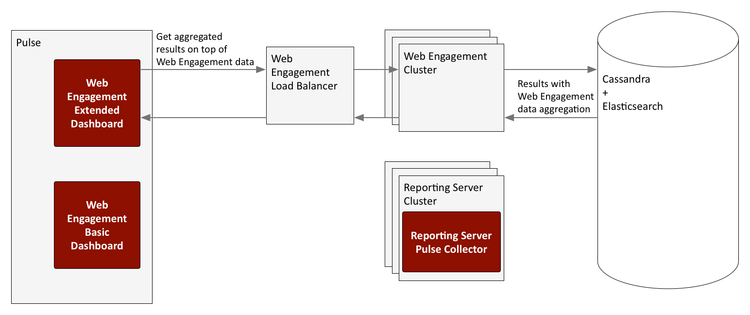
- The extended views (dashboards) are bespoke metric views of Web Engagement data sources hosted directly within Pulse. These widgets cannot be used with other Pulse dashboards.
The following diagrams show the data flow for each type of reporting.
Basic Dashboard
Extended Dashboard
Configuration Options
These configuration option sections can be useful in setting up Reporting Server and your Spark cluster.
log
The [log] configuration options are applied to the Reporting Server environment in a way that is similar to how they are used with Web Engagement Server.
cassandraEmbedded
If you have set up your Reporting Server with an embedded Cassandra node, the [cassandraEmbedded] section provides its configuration options. Their meanings when applied to the Reporting Server environment are similar to the way they are used with Web Engagement Server.
cassandraKeyspace
Reporting Server stores some of its data (packages and schedule) in a dedicated Cassandra keyspace. The [cassandraKeyspace] section provides its configuration options. All of the options mean pretty much the same as they do when used with Web Engagement Server, although some of their values—such as for the name—will be different.
spark
Reporting Server launches a dedicated Spark cluster and all of the Reporting Server nodes need to share the coordinates of the Spark Master node. In addition to this, each individual node has options that can be used to configure the mode with which Spark starts on its box.
host
Description: The name of the Spark Master host. The value should be the same as what Java's InetAddress.getLocalHost() would return for the specified host.
Default Value: None
Valid Values: hostname of the Spark Master node
Mandatory: No
Changes Take Effect: After start/restart
port
Description: The port number of the Spark Master host.
Default Value: 7077
Valid Values: Valid port number
Mandatory: No
Changes Take Effect: After start/restart
startMode
Description: The mode that will be used when starting Spark. If set to off, Spark will not be started by Reporting Server, and will instead have its state managed externally. If set to worker, only a worker node will be started. If set to both, both a worker node and a master node are started. Note: Genesys recommends that you set this option for each node to clearly specify the role. However, you can set the Cluster object to worker mode and override that value for the master node by setting that node to both.
Default Value: worker
Valid Values: off, worker, or both
Mandatory: No
Changes Take Effect: After start/restart
masterWebPort
Description: The number of the TCP port that the Spark Master web UI will listen on. Note that this option is provided for cases when the default port has already been used by another service.
Default Value: 8080
Valid Values: Valid port number
Mandatory: No
Changes Take Effect: After start/restart
workerWebPort
Description: The number of the TCP port that the Spark Worker web UI will listen on. Note that this option is provided for cases when the default port has already been used by another service.
Default Value: 8081
Valid Values: Valid port number
Mandatory: No
Changes Take Effect: After start/restart
executorMemory
Description: Use this option to manage the amount of memory used by Spark for executing tasks on each node. Genesys recommends at least two gigabytes per node, but more memory can improve performance if hardware allows. For information about the format, consult the Spark documentation.
Default Value: None
Valid Values: Valid memory limit
Mandatory: No
Changes Take Effect: After start/restart
sparkHeartbeatTimeout
Description: The timeout value in seconds between two heartbeat calls to the Spark metrics API.
Default Value: 60
Valid Values: Positive integer
Mandatory: No
Changes Take Effect: After start/restart
sparkStartTimeout
Description: The timeout value in seconds between a Spark start or restart and the first time its API is checked. On slower machines, it makes sense to increase this value so that Spark has enough time to start successfully (without initiating a restart cycle).
Default Value: 20
Valid Values: Positive integer
Mandatory: No
Changes Take Effect: After start/restart
uri
Description: Advanced. For situations when Spark is running externally, you must set the URI instead of the host and port. The URI must include the protocol, in addition to the host and port.
Default Value: None
Valid Values: Valid Spark URI
Mandatory: No
Changes Take Effect: After start/restart
spark.context
Advanced. This entire section is copied into SparkContext, so it can be used to tune the Spark options. You must have an in-depth understanding of Spark configuration if you are going to use this section.