Contents
Installing the Reporting Dashboard Plug-in (optional)
Reporting Dashboard Proxy for Genesys Administrator Extension is a GAX plugin that proxies incoming HTTP requests sent from browser-based Kibana clients to the Kibana server, which is controlled by the Web Engagement Server. You must use this plugin when your Extended View reporting dashboards are used in a browser that was launched in a secure zone that is different from the zone containing the Web Engagement Server—for example, if the browser is outside of your VPN in situations where Web Engagement Server is available only through the VPN.
Authentication
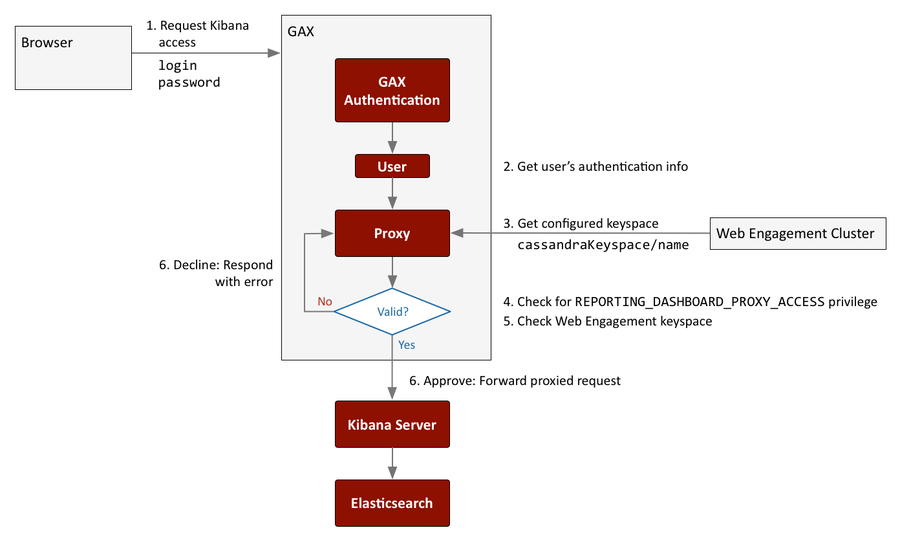
Genesys recommends that you locate database-related components in secure zones, and that you forbid access from less secure zones—especially from the public Internet. This requires the appropriate access restrictions, which must follow a workflow like the one shown here:
As you can see from the diagram, all access to the Kibana server (which is controlled by Web Engagement server) is routed through the Reporting Dashboard Proxy. Direct access must be prohibited at the network configuration level.
Access requests through the Proxy can be approved or declined, depending on the results of the authentication process. Users can only authenticate successfully if they:
- Are logged in as a GAX user
- Have the REPORTING_DASHBOARD_PROXY_ACCESS privilege
To control access to the Kibana server, follow the procedure described at Tuning Role-Based Access in Genesys Administrator, using the Reporting_Dashboard_Proxy_For_GAX.apd template file instead of Web_Engagement_GAX_Plug-in.apd.
Keyspace-based authorization
When Web Engagement Server is started, the proxy retrieves its keyspace configuration information and stores it for use during the authorization process. If an access request is authenticated, the proxy compares the keyspace specified in the request body to see if it matches.
As shown in steps 5 and 6 of the Authentication Workflow diagram, if the keyspace matches, the request succeeds. If not, the proxy returns an error.
Load balancing
The Proxy handles load balancing, forwarding each request to the next available Kibana server. The server URLs are stored in a list, as shown in the table of configuration options. The following diagram shows the load balancing workflow.
Failover
The proxy checks in with the Kibana servers every 10 seconds, as shown in step 3 of the above load balancing diagram. If a Kibana server doesn't respond, the proxy excludes it from the load balancing process. When the server becomes available again, the proxy reincorporates it into the load balancing process.
Installation
Prerequisites
- Your environment includes Genesys Administrator Extension. See Genesys environment prerequisites for compliant versions. For more information about installing the Genesys Administrator Extension, refer to the Genesys Administrator Extension Deployment Guide.
- Installation must be driven from the host where you intend to install the plug-in.
- In Genesys Administrator, navigate to Provisioning > Environment > Applications, select the Genesys Administrator Extension server, and stop it.
- In your installation package, locate and double-click the setup.exe file.
- Click Next. The Choose Destination Location screen appears.
- The destination location is the temporary folder where the plug-in files will be unpacked before they are copied into the GAX structure. You can browse to the desired location or use the default location and click Next. The Ready to Install screen appears.
- Click Install. The Genesys Installation Wizard indicates it is performing the requested operation for the Genesys Reporting Dashboard Proxy. When through, the Installation Complete screen appears.
- Click Finish to complete your installation. As a result of the installation, a new file called gax-plugin-dashboard-proxy-webme.jar is copied to the <GAX installation>\webapp\WEB-INF\lib\ folder.
- In Genesys Administrator, navigate to Provisioning > Environment > Applications, select the Genesys Administrator Extension server, and start it.
Configuration
Proxy configuration information is stored in the GAX Server application, under the wcc-kibana-proxy-plugin section. It includes the following configuration option:
| option | description | example |
|---|---|---|
| kibana-servers | List of the Kibana nodes that will be be used for forwarding | 192.168.1.1:5601,192.168.1.1:5602 |


