Popular reports
You can include the popular real-time reports in your dashboard, so you can quickly start monitoring your contact center. First you need to decide what you want to know about your contact center.
Contents
Genesys Pulse dashboard reports
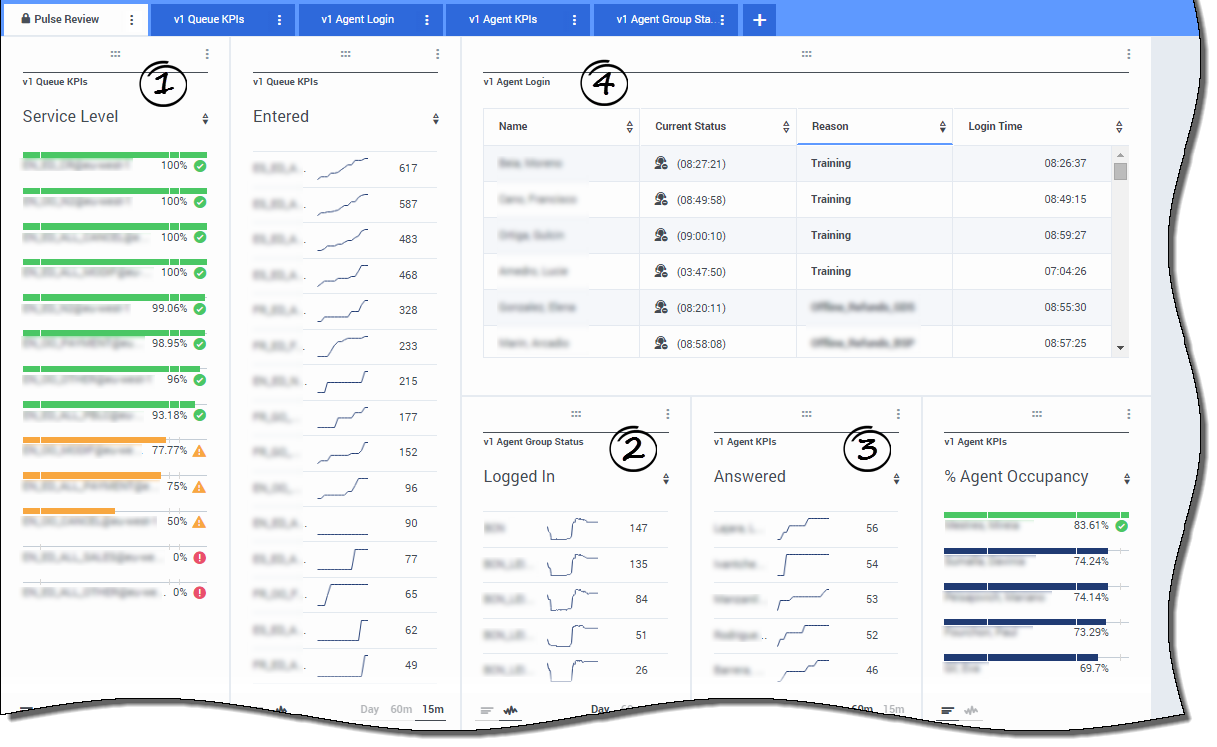
Supervisors need to know at-a-glance what is happening in their contact center. Genesys Pulse displays these reports in widgets, which can easily be expanded to dashboard size as data, bar, and time tracking charts.
Most often supervisors ask the following:
- Will we meet our operational targets?
- How can I manage agent workload across different teams?
- How are my agents performing?
- Are my agents properly assigned?
Meet your operational targets
You can quickly analyze all call activity to determine any action that is needed to reach your target from the Queue KPI report. Similarly, you can analyze chat activity through the Chat Queue KPI report.
A key performance indicator (KPI) in a contact center is often related to abandoned interactions, so it is critical to have a comprehensive understanding of why contacts abandon (for example, lengthy wait times).
Contact center management develops the criteria or level of service that their customers expect. This report provides the primary view used to determine if the contact center is meeting those established operational targets.
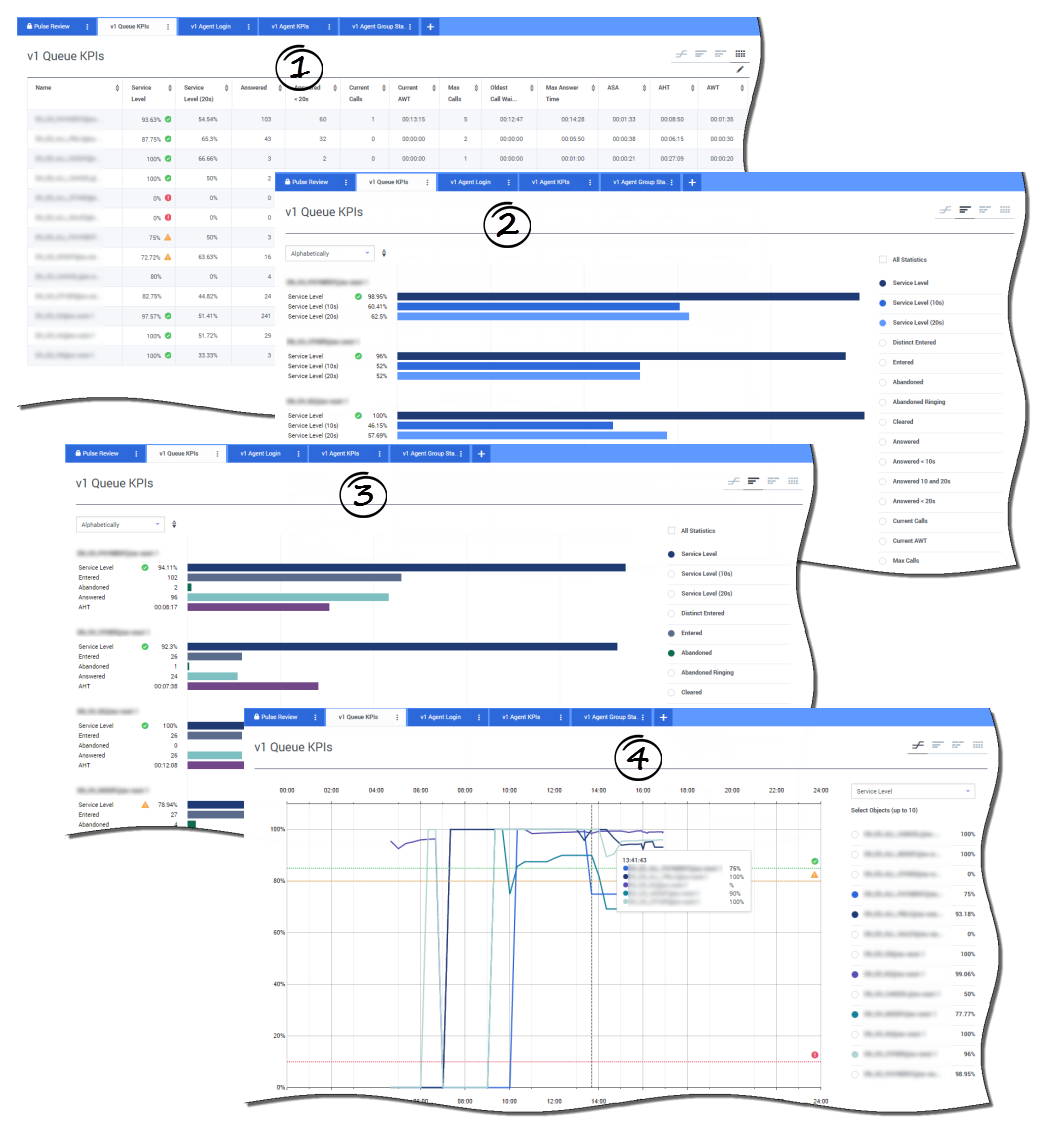
In the examples, the reports show KPIs (for example, Service Level, Calls Answered, Current Calls in queue, ASA, and AHT) for each segment (Virtual Queue related to customer business):
- The data chart helps you identify how to configure specific thresholds based on your SLA.
- The first bar chart shows the Service Level performance with a better granularity and identify times when the service level could be degraded.
- The second bar chart shows the Service Level performance and other KPIs to measure the call distribution performance.
- The time tracking chart shows the Service Level trend within the current day.
How can I manage agent workload across different teams?
In order to manage the workload across different teams, supervisors can monitor their employee availability and behavior in the Agent Group Status reports. This provides supervisors an at-a-glance view of available staff and their current states. For example, you can see what percentage of agents are on calls, on hold, waiting for calls, or not ready with reason.
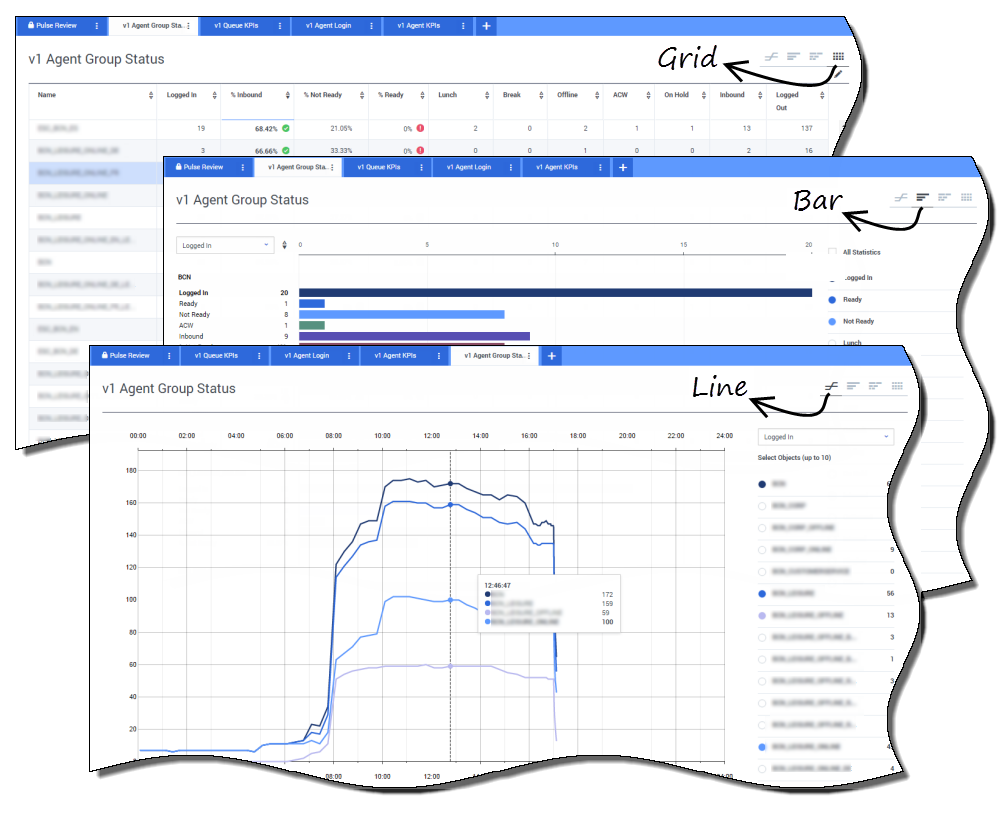
In the expanded view:
- The data chart KPIs and the current status of your workforce.
- The bar chart shows the distribution of agent status for each team.
- The time tracking chart helps you compare the trend of agents logged in for each team.
How are my agents performing?
You can see the KPIs of an agent group in your contact center in the Agent KPI reports. You can analyze other media-specific activity from the Chat Agent KPI and Email Agent KPI reports.
Agents manage many transactions and states in addition or related to answered calls. Genesys Pulse shows you all the data in a single report to provide supervisors with an understanding of agent performance based on the first call resolution. For example, you can see transfers compared to the number of calls answered, which can indicate unresolved first contact customer inquiries.
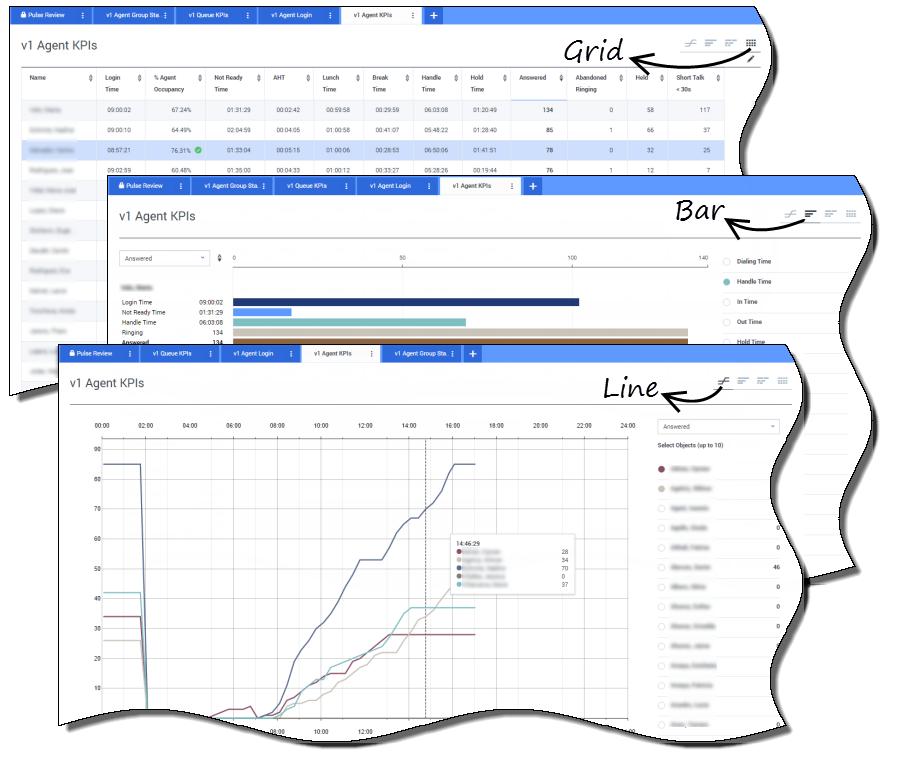
In the expanded view:
- The data chart shows Agent KPIs and the current status of your workforce.
- The bar chart shows agent status and activity. Supervisors can sort agents by specific interests. For example, the supervisor can sort agents by calls answered.
- The time tracking chart compares the trend of calls answered by each agent.
Are my agents properly assigned?
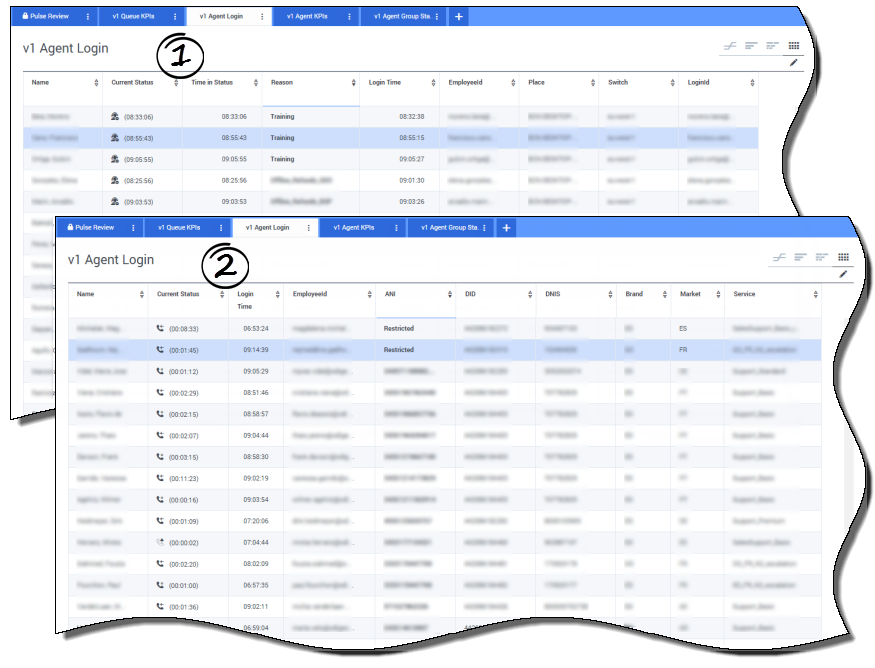
You need to make sure that all aspects of your business are covered. You can see your individual agent properties, status, and the media they manage in the Agent Login report. With this report, supervisors can ensure the agents are logged in where they should be and managing the media for which they are responsible.
In the examples:
- The first data chart shows the reason why agents in a specific group are not ready.
- The second data chart shows the properties related to the call currently handled by agents. It includes 4 KVPs: Service Type, Service Sub Type, Customer Segment and Business Result.
What do I do next?
You might want to learn more about:

