Changing the Forecast

Time Ranges for the Interaction Volume Service Type Trend Report
The Interaction Volume Service Type Trend Report (sometimes called the Trend report) provides a forecast of one service-level measure based on the historical values that are retrieved within the time range that is bound by the start and end dates that you specify. The report provides forecasted data beginning from the end date and extending through the forecast-thru date that you specify, as shown in the figure Time Ranges for the Interaction Volume Service Type Trend Report.
The Interaction Volume Service Type Trend Report uses several variable-based measures (discussed on this page, under Swapping the Forecast Measure) to load the terms for a least-squared forecast calculation. These variables are reserved for internal use; alter them only as instructed below.
Swapping the Forecast Measure
The Measure variable identifies the universe measure that is used to compute the trend. Resetting this variable to another measure will not break the formula. As packaged, the % First Response Service Level measure in the BA Customer class is assigned to this variable. You can customize a copy of the report to provide a forecast of a different measure. To do so, perform the following steps:
[+] Show Steps
- Choose the measure that you want to substitute—for example, Entered, in the Business Attributes class.
- Within BI LaunchPad, make a copy of the Interaction Volume Service Type Trend Report and retitle it accordingly—for example, Interaction Volume Entered Trend Report:
- Select the report to copy, and choose Organize > Copy.
- Select the folder in which to paste the report, and choose Organize > Paste.
- Right click the report and choose Properties. Edit the Title, and click Save & Close.
- Right-click a report, and in the context menu, select Modify to open the report for editing.
- On the Data Access tab, Data Providers sub-tab, click Edit Data.
- On the Query Panel, add the measure you want to add to both combined queries (Combined Query 1 [for current data] and Combined Query 2 [for forecasted data]):
- Select Combined Query 1, then double click the measure you want to add (this adds it to the Result Objects field).
- Select Combined Query 2, then double click the measure you want to add (this adds it to the Result Objects field).
Do not yet remove the % First Response Service Level measure.
Close the Query Panel.
- From the toolbar, click Design > With Data.
- In the Available Objects list, double-click Measure to open the Edit Variable dialog box.
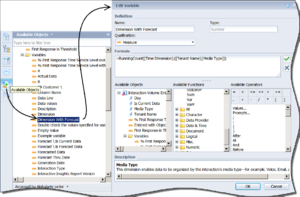
The figure Edit Variable shows the main Available Objects list, and the Edit Variable dialog box. Note that the Edit Variable dialog box also contains a list called 'Available Objects'.
- Create the new variable as follows:
- In the Name field, type a name for the variable.
- In the Formula field, replace [% First Response Time Service Level] with the measure that you chose in Step 1 (for example, Entered) and click OK.
- If your selected measure yields values that are greater than 1—as is the case with the example Entered, given in Step 1—perform the following steps on the Main tab of the report:
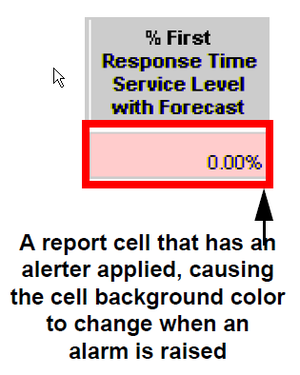
- Set Forecast Alerter (the alerter that is associated with the forecast column, shown in the figure Alerter) appropriately, or remove it altogether.
- Update the legend.
- In the Available Objects list, double-click the Trend Line variable and change its formula to the following:
If [A] * [Dimension With Forecast] + [B] < 0 Then 0
Else [A] * [Dimension With Forecast] + [B]
- Appropriately rename any strings that indicate the name of the measure that is to be replaced. On the report Summary tab, for instance, change the name of the axis, change the chart name, and, in the report structure, change the hardcoded string % First Response Time Service Level over Time to Entered over Time.
- On the report Description tab, add the Entered measure and its description to the table. Change the report description appropriately.
- (Optional) On the Query Panel, remove any measures that you no longer want to appear in the query.
- Save and test your report.
Tip
In the GI2 universe, the
First Response in Threshold and
Entered with Objective measures (the first two columns of the Trend report) are used to derive
% First Response Time Service Level (the third column in the report). If you swap the service-level measure for another, as instructed in the preceding section, you might also want to swap out the first two measures. Be sure to add any new measures to both halves of the underlying combined query and set the columns of the main table appropriately.
Managing the Report Dimensions
Among the internal variables of the Interaction Volume Service Type Trend Report are some that parameterize dimensions. This section demonstrates how to modify such variables and the report structure to reflect different
dimensions.
Changing Dimensions Other than Time dimensions
The following abbreviated steps demonstrate how to define additional or fewer dimensions within the report:
[+] Show Steps
- On the Query Panel, add the desired dimension to (or remove it from) both combined queries.
- In the Available Objects list, double-click Dimension With Forecast to open the variable editor. Change this variable definition to include or remove the desired dimension. For instance, the following definition adds the Service Type dimension:
=RunningCount([Time Dimension];([Tenant Name];[Media Type];[Service Type]))
- Click Document Structure and Filters and modify the report section as desired.
- Save and test your report.
Changing Time Dimensions
To change the report time dimension, perform the following abbreviated steps:
[+] Show Steps

Hidden Columns in the Trend Report
- In the Query Panel, add the desired time dimension to both combined queries. For example, add Month. Do not yet remove the Day dimension.
- In the Available Objects list, double-click Time Dimension to open the variable editor.
Change this variable definition to match the added dimension—for example, to =[Month].
- Click Close > Apply changes and close.
Between the first two visible columns in the main table of the report are two hidden columns: [Day] and [Is Current Data]. The figure Hidden Columns in the Trend Report shows the hidden [Day] column, highlighted within the red rectangle.
- Select the hidden [Day] column and change its formula to your desired dimension—for example, to =[Month].
- (Optional) On the Query Panel, remove any time dimensions that you no longer want to appear in the query.
- Save and test your report.


