Troubleshooting
Contents
Verify Ports are Open
Verify whether domain, IP's, and ports are accessible from the client.
- To send UDP, go to:
http://<app-server>.domain.com/zqa/mictest.jsp
- And change the left box to:
rtmfp://<mcu>.domain.com:14049
- For SSL/TCP go to:
https://yourdomain.com
- Verify that you receive a page and a green padlock in Chrome.
- To listen on the MCU or AS when testing specific ports, you can use Wire-shark as shown here:
tshark -f "tcp port 443" -i eth0
Check MCU and MCU Helper Processes are Running
Check for MCU
Running this should print out at least one number:
pidof maxmcuCheck for AVRW
Running this should report back two processes:
ps aux | grep startavExample:
root      4022  0.0  0.0 279160  6588 ?        Sl   Jan22   5:35 /opt/zenon/avservices/AVReaderWriter/startavreader -x -c /opt/zenon/avservices/AVReaderWriter/AVServicesprod.conf
root      4078  0.0  0.0 279160  6596 ?        Sl   Jan22   5:26 /opt/zenon/avservices/AVReaderWriter/startavwriter -x -c /opt/zenon/avservices/AVReaderWriter/AVServicesprod.conf
Check for AVFRW
Running this should report back a number:
ps aux | grep startflashExample:
root      4622  0.0  0.0 450884  7496 ?        Sl   Jan22   5:55 /opt/zenon/zenonserver/AVFlashServices/AVFRW/startflashwriter -x -c /opt/zenon/zenonserver/AVFlashServices/AVFRW/democonfig.cfg
root      5129  0.0  0.0 450884  7492 ?        Sl   Jan22   5:52 /opt/zenon/zenonserver/AVFlashServices/AVFRW/startflashreader -x -c /opt/zenon/zenonserver/AVFlashServices/AVFRW/democonfig.cfg
Useful URLs
- Test interaction between components: https://<yourdomain>/user/dev/zebra.jsp
- WebRTC test page: https://<yourdomain>/user/demo/w.jsp
- Testing UDP ports: http://<yourdomain>/zqa/mictest.jsp
- Click-To-Call demo page: http://<yourdomain>/user/demo/index.jsp
- Real-time monitoring: http://<yourdomain>:2131
- Current config value: https://<yourdomain>/it.jsp?it=[config_key]
- Printing cookies: http://<yourdomain>/cook.jsp
Check Component Logs
For AS, NS, and MCU, the logs are stored in the /opt/zenon/logs folder. For the TURN Server, the logs are in the /var/log folder.
AS logs are logged into the cls.log file. The default log file size is 5Mb and it's rotated as cls.log.xx. A maximum of 100 files is supported.
NS logs are logged into the zs.log file. The default log file size is 20Mb and it's rotated as zs.log.xx. A maximum of 10 files is supported.
For MCU there are two processes:
- mcu_saypage_2130_[date]_xx.log files are generated every hour.
- mcu_zenon_2130_[date]_xx.log files are generated every hour.
- The MCU logs are not rotated and need periodic cleanup.
TURN server logs are logged into the turn_xxx.log file. These are generated on a daily basis and need periodic cleanup.
To enable debugging for AS or NS, update /opt/zenon/zenonserver/log4j.properties, and set the log level to INFO in the Threshold parameter. The default is ERROR.
For MCU debugging, set Log Level parameter in /opt/zenon/public_html/WEB-INF/infotypes_saypage.xml 4 or 5. The default is 3.
For debugging within the log files you can check for various messages, like these:
- To find the commands going into AS: grep Brora cls.log
- REQUEST_SPEED, SLOW REQUEST and SLOW QUERY shows the response time for the request.
- To find HTTP calls to AS from MCU: grep "http://localhost[^:]” mcu*.log
- To find HTTP calls to NS from MCU: grep “http://localhost:14040” mcu_*.log
- To find for MCU allocation pass/fail: grep MCUALLOCATION cls.log
- To find the messages received by NS from browser: : grep “( ZCSocket.onWebSocketText )” zs*.log.
- To find the HTTP responses sent to browser from NS: grep “( ZCSocket.sendMessage ) Message sent to client” zs*.log
- To find the HTTP requests received by NS from MCU: grep “Recvd Zebra message from MCU or CLS:” zs*.log
- To find the HTTP requests sent by NS to MCU: grep “HttpRequest.sendRequest” zs*.log
Startup Issues
If you see that the web pages are not accessible after startup, follow these steps:
- Issue the following command as zenon_maint user: /usr/bin/sg zenon_maint_group "/opt/zenon/sh/monitor_zenon.sh &> /opt/zenon/logs/startup.log”.
- Kill the Java process returned by ’ps –elf | grep zs.prop’.
- Look for any error or exception in the startup.log file generated in Step 1. You can also check the AS log file, cls.log, from the platform logs directory.
- If the platform still has issues:
- Stop the platform by using /opt/zenon/sh/stop_genesys_video.sh.
- Clean the temp/cache/log files using the command '/bin/rm /tmp/org.red5* /opt/zenon/run/* /opt/zenon/logs/*' (This is to make sure that the issue is not related to file permissions.) If you encountered permission errors when performing the cleanup, you may need to do this step as ‘root’ user; make sure that you first backup any necessary log files from /opt/zenon/logs/.
- Restart the platform using /etc/init.d/zenon_zs.
- If the issue persists, reboot the system, and then restart the platform using the method in the previous step, provided it is not restarted automatically by init.d.
Check System Performance
The following commands can be used to extract information on the system’s performance.
- First, install the sysbench package. It is included in the extras folder of the Common IP:
sudo yum -y --nogpgcheck localinstall postgresql-libs-8.4.20-2.el6_6.x86_64.rpm
sudo yum -y --nogpgcheck localinstall sysbench-0.4.12-5.el6.x86_64.rpm
- To test CPU performance, run:
sysbench --test=cpu --cpu-max-prime=20000 run
- To test FILE IO (Disk performance), run:
sysbench --test=fileio --file-total-size=150G prepare
- Then run:
sysbench --test=fileio --file-total-size=150G --file-test-mode=rndrw --init-rng=on --max-time=300 --max-requests=0 run
- To test MySQL performance, run:
sysbench --test=oltp --oltp-table-size=1000000 --mysql-db=test --mysql-user=root --mysql-password=yourrootsqlpassword prepare
- Then run:
sysbench --test=oltp --oltp-table-size=1000000 --mysql-db=test --mysql-user=root --mysql-password=yourrootsqlpassword --max-time=60 --oltp-read-only=on --max-requests=0 --num-threads=8 run
- Finally, to clear the test table, run:
sysbench --test=oltp --mysql-db=test --mysql-user=root --mysql-password=yourrootsqlpassword cleanup
Garbled Audio Issue with Flash
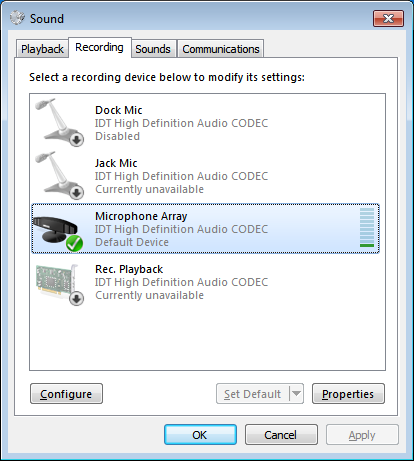
If the client machine contains multiple recording devices (mics), then it's necessary to set the default recording device and possibly disable the unused or unavailable ones (like Jack mic or Doc mic if not available). Otherwise, Flash has some issues in selecting the correct mic and produces garbled audio in a Click-to-Call scenario.
In Windows, for example, go to the Sound window, and click or tap on the Recording tab. Your current default device is indicated by a green check mark. Select your preferred device and click or tap Set Default.

