Understanding the Reports
This section helps you understand GI2 reports, how to work with them in Web Intelligence, and how to customize them to suit your needs.
The GI2 reports for Genesys Info Mart compile contact center interaction activity and agent-summarized states for telephony and multimedia DNs.
Agent-based reports do not contain data that summarizes virtual interactions, virtual agent activity, and Interactive Voice Response (IVR) port activity. However, data that pertains to IVR ports is included in the business attribute and interaction detail reports if IVRs are configured as handling resources in your environment.

Managing Reports Using InfoView
The GI2 release for Genesys Info Mart 8.1 includes the following reports:
- 16 agent activity reports
- 7 queue activity reports
- 6 detail reports
- 3 outbound contact reports
- 9 business attribute reports.
All of these reports were designed using Web Intelligence. The reports use the hierarchies, classes, dimensions, details, conditions (filters), measures, and prompts that are defined in the corresponding Interactive Insights universe: GI2_Universe. The figure Managing Reports Using InfoView shows the organization of some of the reports in the Agents folder and some of the operations that you can perform within InfoView—the BO portal to Web Intelligence. To learn about performing basic report operations, such as running and scheduling reports and printing, sharing, and exporting their results, refer to the BO XI 3.1 or BI 4.1 documentation.
Common Elements of Design Across All Reports
Viewing Reports Using Web Intelligence
When you view, run on-demand, or modify a report, the report opens in the Web Intelligence interface, as depicted in the figure Viewing Reports Using Web Intelligence. As an administrator, you can configure permissions that determine whether Web Intelligence is available for each user and which operations each user can perform.
| Main and Description Tabs
|
[+] Show Description
Each report includes a User Prompt Input area, a Description tab that describes the report’s measures, and a Main tab (for most reports) that contains one report. A few reports have a different design: The Agent Summary Activity Report document contains 4 main tabs that house 4 reports, titled Active Time, % Active Time, Interaction Time, and % Interaction Time. The Agent Utilization Report uses 2 main tabs, titled Customer and Consult. Instead of a main tab, the Business Executive Report provides 3 summary tabs: Business Result, Customer Segment, and Service Type.
|
| Main and Date Range Queries
|
[+] Show Description
If your user account has access permissions of an Interactive Insights Editor or Developer, the Edit button is available to you, and you can click it to view and edit a report’s layout and underlying query.
Click the Edit button to open the Report Panel, and then click the Edit Query button (available only to Developer users), to open the Query Panel and show the report’s building blocks.
Most GI2 reports display the results of two queries, Main Query and Date Range Query. However, in order to achieve a particular end result, a few reports incorporate a third (or fourth) query. Two reports—the Interaction Volume Service Type Trend and the Agent Details Activity reports—use a combined query, as shown in the figure Combined Query. If you have to customize reports, make sure that you are working with the correct query when there is more than one.
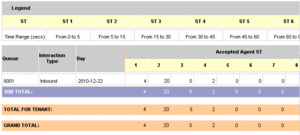
 Cutaway of the Query Panel for the Agent Not Ready Reason Code Report The figure Cutaway of the Query Panel for the Agent Not Ready Reason Code Report shows the Main Query, the Date Range Query, and the Total Not Ready Query of the Agent Not Ready Reason Code Report. Other reports that make use of three or more queries include the following:
- Agent Conduct Report
- Agent Interval Based Report
- Agent Not Ready Reason Code Report
- Agent Summary Activity Report
- Agent Wrap Report
- Business Metrics Executive Report
- Interaction Volume Summary Report
|
| Summary Tabs
|
[+] Show Description
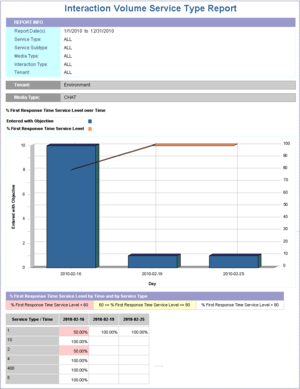
 Summary Tab of the Interaction Volume Service Type Report Many reports include one or more Summary tabs that highlight exceptional events that occur within your contact center or enterprise. Depending on the report, these exceptions might be highlighted in one or more colors to enable you to focus quickly on highly productive or problematic areas. The figure Summary Tab of the Interaction Volume Service Type Report shows sample data on the Summary tab of the Interaction Volume Service Type Report. With the exception of the Interaction Flow Report, none of the detail reports (that is, reports stored in the Details InfoView folder) include a Summary tab.
|
What Zero Signifies
Whenever the underlying query for a GI2 report returns no rows, the report displays no data. For example, a query to retrieve activity for a particular agent for a shift that the agent did not work returns no data. On rare occasions, Web Intelligence returns No data to retrieve in Main Query.
[+] More Information
Zero Values in the Speed of Accept Report
For those GI2 reports that do return rows, but in which a particular field is not applicable, the reports return a value of 0. For example, suppose that all interactions for a particular day were accepted within the first four service time intervals that were defined for a tenant, but none were accepted beyond the fourth interval. As a result the Speed of Accept (seconds) Report—a portion of which is shown in the figure Zero Values in the Speed of Accept Report—displays 0 values for the each of the fifth through tenth intervals.
The reports also return 0 for measures when the underlying database columns on which measures are based hold 0 values. Additionally, when a report is based on a query that gathers data from more than one aggregation table, empty cells in reports are possible where other cells contain data.
For composite measures, such as percentages and averages, wherever a 0 count or 0 duration ensues, the reports display 0 for such measures. The average duration of calls placed on hold, for instance, is 0 in the circumstances where either no calls were placed on hold during the interval, or where the duration of held calls was 0 seconds (or a fraction of 1 second).
The custom reports that you create might behave differently depending on their design. Refer to BO XI 3.1 or BI 4.1 for further information.
Printing Reports
GI2 reports are optimized for onscreen viewing, though where possible they are also designed to be legible when printed.
Some of the charts and tables that are presented on the Summary tabs of reports use background colors (for example, green, red, and yellow) to summarize the information that is provided in the main report tab; these colors might be difficult to differentiate when the report is printed to a black-and white printer.
[+] More Information
Printing most reports requires tabloid-size paper (11x17”) and most reports are output with landscape orientation. Reports that contain a lot of data, such as the Queue Summary and Agent Utilization reports, encroach the minimum margin space that is required for some printers. If you find that your printed output is cropped at the margins, consider scaling down the report output to satisfy the minimum allowable margins for your printer. Typically, you can accomplish this either by adjusting the settings in the Print dialog box of your printer driver, or through the Print Setup or Page Setup menu items of the software application of the report output. As well, you can scale output with some of the supported BO output formats. Consult the software documentation of your targeted output format to learn about its ability to scale, as well as the hardware documentation for your specific printer for information about the minimum margin widths.
Personalizing Report Instances
Using the built-in features of BO, you can publish reports in a manner that limits the dataset that is exposed to report viewers when they open a report instance. Do this by personalizing the dataset to a dynamic profile that is defined in the Central Management Console (CMC).
Tip
In addition to (or instead of) using the method described in this section, you can restrict user access to data using integrated, role-based Data Access Restrictions, described in the
Genesys Interactive Insights Deployment Guide.
To personalize Report Instances, you must log in with a user account that has administrative privileges. The following procedures describe customizations using BO XI software, documents, and terminology.
| 1. Creating a Dynamic Profile Within CMS.
|
The task of personalizing report instances begins with the creation of one user profile within the Central Management Server (CMS). [+] Show Steps Profiles work in conjunction with publications to personalize the content that users see. This sample profile will be dynamic—classifying users and groups, based on the user name that is issued to log in to InfoView. However, you can create other types of profiles that are based on other variables or on one or more fixed values.
To create a dynamic profile, perform the following steps:
- Open CMC, and select Profiles.
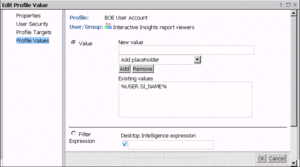 Setting a Dynamic Profile Value - Create and name a new profile. The figure Setting a Dynamic Profile Value shows the creation of the BOE User Account profile.
- Open the profile and add a new profile value.
- Select Profile Values from the list on the left-hand side.
- Click Add in the upper right-hand section of the frame.
- Click Choose to the right of User/Group.
- Select the targets of your publication from the frame on the left-hand side, move them to the right, and then click OK.
The figure to the right shows one of the Genesys-provided default groups: Interactive Insights report viewers.
- With the Value option selected, select the Title placeholder profile value from the list box. CMC autofills the New value field with a variable: %USER.SI_NAME%. Click Add to move this value to the Existing values list, as shown in the figure Setting a Dynamic Profile Value.
- Click OK, and then click Close to close the profile.
Creating this dynamic profile enables you to concentrate configuration refinements to one BO object; you do not have to configure data-restriction rules individually for each recipient. Next, you must apply the profile to a publication that is distributed to report-viewer recipients. Refer to “Managing Profiles” in the relevant SAP Administrator's Guide for more information about creating profiles (see ).
|
| 2. Applying the Profile to a Publication
|
The next step is to create a publication within InfoView. [+] Show Steps Continuing with the example shown in Step 1 (Creating a Dynamic Profile Within CMS), this step shows you how to create the Agent Conduct Publication, which uses the Agent Conduct Report as the source document. To this publication, you add the BOE User Account profile that was created earlier. Finally, you schedule the publication for distribution to all Interactive Insights report viewers.
- Within InfoView, create a publication that points to a WebI report as the source document. This example names this publication Agent Conduct Publication, and specifies the Agent Conduct Report as the source document.
 Assigning a Local Profile to a Publication - Open and modify the publication’s properties, as follows, to associate with it the previously created profile:
- From the list of properties, select Personalization.
- In the Local Profiles section, from the Report Field list box, select a
value that will serve as the filter.
The figure Assigning a Local Profile to a Publication shows the Agent Name field from the report’s Agent query selected for this option.
Note that, unlike most other Interactive Insights reports, the Agent Conduct Report is built from the unified results of two queries. Most other reports are built from one query.
- From the Enterprise Recipient Mapping list box, select the profile you created in the previous procedure.
(The Enterprise Recipient Mapping list box appears only after you have selected a report field.)
- Set other properties (Destinations and Recurrence), as appropriate for this publication; then, click OK to save and close the publication.
- Schedule the publication for distribution as desired.
Refer to the relevant SAP Publisher’s Guide for more information about creating and scheduling publications (see ).
|
| 3. Modifying the Agent Name Dimension
|
The final step in personalizing a report is to modify the Agent Name Dimension. [+] Show Steps If you followed the example in Step 1 (Creating a Dynamic Profile Within CMS), you defined a filter that is associated with BO account names (a dynamic profile, which changes according to the manner in which the user logs into InfoView). This filter limits the data that is exposed to users. As packaged, however, no GI2 report contains any object that directly correlates to BO account names. To complete this example, therefore, you must tailor one universe object to synchronize it with BO user account names, which ensures that users see only data from their own dataset.
The User Name detail dimension is the closest universe object that can be associated with a BO account name. This requires that you configure BO user names in the same manner in which users are configured within Configuration Server. In the 8.1 release, however, no GI2 reports employ the User Name detail dimension in their design; the Agent Name dimension is used instead. Agent Name is a composite entity comprised of three components when their values are not null:
- Last Name
- First Name
- Resource Name
There are three solutions from which you can choose:
- Modify all of the reports to substitute User Name for Agent Name, modify the report layouts that section and filter on this dimension, and conduct testing.
- Add the User Name detail to the query and layout of those reports wherever the Agent Name dimension appears.
- Alter the definition of the Agent Name dimension in the few classes where it exists.
This example uses the third option.
To modify the Agent Name definition:
<toggledisplay showtext="[+] Show Steps" hidetext="[-] Hide Steps">
- Open Designer and navigate to the Agent\Activity class.
- Open the properties of the Agent Name dimension, clear the WHERE clause,
and change the Select statement to the following:
@Select(Activity\User Name)
Or, mimic the User Name detail definition:
RESOURCE_GI2.RESOURCE_NAME
- Save the definition by clicking OK.
- Repeat this modification for all other Agent Name dimensions that exist throughout the universe.
- Save the universe and export the changes back to the repository.
- Test by running agent-related reports and comparing results to expectations.
Subsequently, when a BO user opens a report instance that was distributed by the publication, the results that the user sees are limited to only those records in which Agent Name is equivalent to the name of the user’s own BO user account.
|
| Limitations of personalization
|
The following limitations apply: [+] More Information
Profiles filter the view of a document’s content; profiles do not restrict the data that is being queried from the data source nor do they control users’ access to data. If users have the appropriate rights to access documents in their original format, they can see the document’s entire dataset.
Altering the definition of the Agent Name dimension—or replacing this dimension altogether within the reports—is neither supported nor tested by Genesys Quality Assurance. Subsequent redesign and testing can be extensive, depending on the option that you choose to associate contact center objects with BO objects. Genesys has not assessed the full impact of such changes, such as the continued functionality of drill-down/drill-up operations.
|
For additional information about working with reports, see the section Working With Reports in Web Intelligence.


