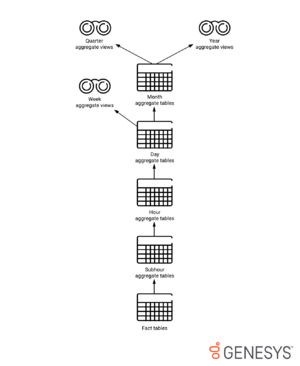
Reporting And Analytics Aggregates
Also known as RAA. An optional Genesys Info Mart process that creates and populates predefined aggregation tables and views within an Info Mart database. RAA aggregation tables and views provide the metrics that summarize contact center activity to facilitate reporting, and serves as the primary source of data for the Genesys CX Insights (GCXI) historical reports. RAA is required for Genesys CX Insights, and was required for the now-deprecated GI2.
Glossary
Contents
What is an Aggregation Hierarchy?
The hierarchies that are present in the aggregation layer are based on time—ranging from subhour table or view constructs to year views of contact center data.
Factual data (for example, from the MEDIATION_SEGMENT_FACT table) is gathered and grouped by a specific time interval (as well as by other dimensions) and then written to a time-based aggregate table or made available via aggregate views that are based on these FACT tables and lower-level aggregation tables.
This page explains the hierarchies of Reporting and Analytics Aggregates (RAA):
Aggregation Intervals
RAA provides aggregation tables or views for the following seven time intervals: Subhour, Hour, Day, Week, Month, Quarter, Year
The definition of subhour is configurable using the sub-hour-interval Genesys Info Mart configuration option at either 15 minutes or 30 minutes. Each level derives its data by aggregating values from the preceding node in the hierarchy, as shown in the Figure The Aggregation Hierarchy.
The fact tables at the bottom of the Figure The Aggregation Hierarchy store the individual interaction-, session-, or state-related details. Fact tables are populated and maintained outside of RAA by Job_LoadGIM, Job_MaintainGIM, and other Genesys Info Mart jobs. The RAA Physical Data Model Documentation for your RDBMS describes the fact table(s) that serve as the source for a particular hierarchy from whence data is aggregated, and the relevant Genesys Info Mart Physical Data Model Documentation describes these fact tables in detail.
Unlike the initial release (shown in the Figure Release 7.x Interval-Based Measures Model), the Interval-Based Measures model in 8.x derives its values from the previous node in the hierarchy, instead of directly from the source fact table. This design enhancement puts less strain on database resources by improving the performance of queries run against these tables. The 8.x Interval-Based Measures model also includes week, quarter, and year views for each hierarchy, which the Release 7.6 model did not. The Disposition-Based Measures model is the same as was presented in the initial 7.6 release.
Hierarchies of the Aggregation Layer
RAA defines hierarchies for each set of aggregate tables and views; these hierarchies differ in composition only by their time interval of aggregation. Views AG2_QUEUE_HOUR and AG2_QUEUE_YEAR, for instance, share a hierarchy, whereas the AG2_QUEUE_HOUR and AG2_QUEUE_GRP_HOUR views do not.
Disposition-Measure Hierarchies
The RAA Disposition-Based Measures model consists of ten hierarchies:
- The H_AGENT hierarchy—Consisting of the following views:
- The AG2_AGENT_SUBHR view
- The AG2_AGENT_HOUR view
- The AG2_AGENT_DAY view
- The AG2_AGENT_WEEK view
- The AG2_AGENT_MONTH view
- The AG2_AGENT_QRTR view
- The AG2_AGENT_YEAR view
- The H_AGENT_GRP hierarchy—Comprising rollups of values from the H_AGENT hierarchy and consisting of the following views:
- The AG2_AGENT_GRP_SUBHR view
- The AG2_AGENT_GRP_HOUR view
- The AG2_AGENT_GRP_DAY view
- The AG2_AGENT_GRP_WEEK view
- The AG2_AGENT_GRP_MONTH view
- The AG2_AGENT_GRP_QRTR view
- The AG2_AGENT_GRP_YEAR view
- The H_AGENT_QUEUE hierarchy—Following the same pattern of tables and views as the H_AGENT hierarchy.
- The H_AGENT_CAMPAIGN hierarchy—Following the same pattern of tables and views as the H_AGENT hierarchy.
- The H_CAMPAIGN hierarchy—Following the same pattern of tables and views as the H_AGENT hierarchy.
- The H_ID hierarchy—Following the same pattern of tables and views as the H_AGENT hierarchy.
- The H_QUEUE hierarchy—Following the same pattern of tables and views as the H_AGENT hierarchy.
- The H_QUEUE_ABN hierarchy—Following the same pattern of tables and views as the H_AGENT hierarchy.
- The H_QUEUE_ACC_AGENT hierarchy—Following the same pattern of tables and views as the H_AGENT hierarchy.
- The H_QUEUE_GRP hierarchy—Following the same pattern of tables and views as the H_AGENT hierarchy., and comprising rollups of values from the H_QUEUE hierarchy.
Interval-Measure Hierarchies
The RAA Interval-Based Measures model consists of three hierarchies:
- The H_I_AGENT hierarchy—Consisting of the following views:
- The AG2_I_AGENT_SUBHR view
- The AG2_I_AGENT_HOUR view
- The AG2_I_AGENT_DAY view
- The AG2_I_AGENT_WEEK view
- The AG2_I_AGENT_MONTH view
- The AG2_I_AGENT_QRTR view
- The AG2_I_AGENT_YEAR view
- The H_I_SESS_STATE hierarchy—Following the same pattern of tables and views as the H_I_AGENT hierarchy.
- The H_I_STATE_RSN hierarchy—Following the same pattern of tables and views as the H_I_AGENT hierarchy.
How Hierarchies Are Used Within RAA
The aggregation process references several select-*.ss files that are located inside the Java aggregation archive (lib/meta-8.x.x.jar). These files were written using the Scheme programming language. Each Scheme file identifies the hierarchy to which the file applies, along with instructions (that is, code) for generating that hierarchy’s measures. The aggregation process follows these instructions to populate all of the tables that belong to the hierarchy. For information about editing the Scheme files, see How Do I Customize Queries and Hierarchies?.
Hierarchies are also referenced within the user-data mapping file, user-data-map.ss, which you prepare to extend the dimensions by which aggregated data can be partitioned. Refer to How Do I Configure User Data for Aggregation? for information about its use.
RAA also manages a number of parallel hierarchies exclusively for migration purposes. These migration hierarchies are temporary in nature and are not further described in RAA documentation.


