Profiling and Performance Services
Using JMX Agent
Java Management Extensions (JMX) provide built-in profiling and management options, including an API for monitoring Java applications. This API provides access to information such as:
- Number of classes loaded and threads running
- Virtual machine uptime, system properties, and JVM input arguments
- Thread state, thread contention statistics, and stack trace of live threads
- Memory consumption
- Garbage collection statistics
- Low memory detection
- On-demand deadlock detection
- Operating system information
To enable monitoring for a Java application, first launch the JVM with the default JMX agent turned on using the com.sun.management.jmxremote.port=<portNum> system property.
-Dcom.sun.management.jmxremote
-Dcom.sun.management.jmxremote.port=portNum
Once these system properties are set, you can use jconsole to monitor the intended Java application. First use the appropriate system tools to determine the process ID for your running application. For example, on Windows systems you can use Task Manager to find the process ID of the java or javaw process. Once the process ID is known you can start jconsole from the jdk/bin directory:
jconsole <processID>
Heap memory is the runtime data area from which the JVM allocates memory for all class instances and arrays. The heap may be of a fixed or variable size. The garbage collector is an automatic memory management system that reclaims heap memory for objects.
Non-heap memory includes a method area shared among all threads and memory required for the internal processing or optimization for the JVM. It stores per-class structures such as a runtime constant pool, field and method data, and the code for methods and constructors. The method area is logically part of the heap but, depending on implementation, a JVM may not garbage collect or compact it. Like the heap, the method area may be of fixed or variable size. The memory for the method area does not need to be contiguous
Platform SDK MBeans
There are three types of Platform SDK MBeans available:
- ClientChannel Monitor
- ServerChannel Monitor
- ThreadHeartbeatMonitor
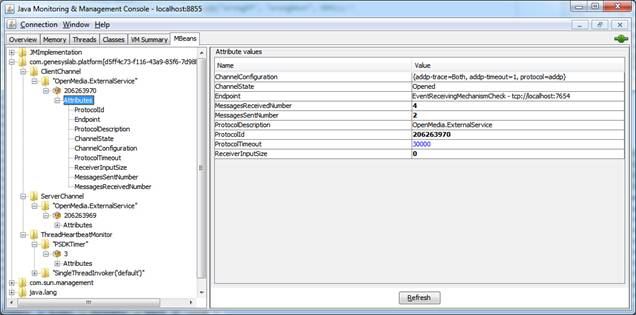
Descriptions of each MBean and a sample JConsole screenshot showing what they might look like are provided below.
ClientChannel Monitor
The ClientChannel MBean object represents a single instance of an opened client protocol connection.
It exposes several properties of the client connection for monitoring/debugging purposes, such as:
- protocol type
- protocol ID (that is, the unique ID of the protocol instance)
- a string representation of the client connection endpoint
- connection configuration
- counters for the number of sent and received messages
The ReceiverInputSize property reflects the number of asynchronous incoming messages which were received by the protocol connection, but were not retrieved by the application. If this property has a large value during runtime then it may indicate that there was an overload, hang-up, or memory leak in the application.
The only property that you can modify (using JMX) in the ClientChannel MBean is ProtocolTimeout.
ServerChannel Monitor
The ServerChannel MBean object represents a single instance of the Platform SDK ServerChannel.
This MBean exposes similar information to the ClientChannel Monitor, but also includes counters for the number of accepted and active client collections.
ThreadHeartbeatMonitor
ThreadHeartbeatMonitor is designed to support the Genesys Management Framework Hang-up Detection feature.
Platform SDK provides this class for server-type applications to allow integration with the Hang-up Detection feature. Developers may create instances of this class in their applications to act as a heartbeat for functional threads, and then add "ticking" calls in their code. An opened LCA connection with proper configuration will then allow Genesys Management Framework to collect information about the heartbeats. If the heartbeat counter stops and specific configuration options are enabled, then Solution Control Server may request that LCA restart the application as hanged up.
Platform SDK exposes the following internal threads: PSDK Timer, and workers of SingleTreadInvoker instances. Other internal Platform SDK threads (including connection layer and Netty executors) do not use the heartbeat functionality.
Thread Monitoring
Thread Monitoring Functionality in Platform SDK for .NET
All threads (both user thread and internal Platform SDK threads) for any user application built with Genesys Platform SDK can be monitored, and run-time information for each thread can be gathered at any time. This information gathering and accessibility are supported by standard .NET framework technology related to PerformanceCounters. See http://msdn.microsoft.com/en-us/library/system.diagnostics.performancecounter.aspx for details.
PerformanceCounter Name Constants
String constants (names) which are used for managing PerformanceCounters are as follows:
 public const string CategoryName = "Genesyslab PSDK .NET";
 public const string HeartbeatCounterName = "Thread Heartbeat";
 public const string StateCounterName = "Thread State";
 public const string ProcessIdCounterName = "ProcessId";
 public const string OsThreadIdCounterName = "OsThreadId";
These constants are defined in the ThreadMonitoring class. In addition to these custom Platform SDK performance counters, users can also use standard counters. For example, both "% Processor Time" and "% User Time" are defined in the Thread category.
 <configuration>
   <appSettings>
     <add key="ProfilingEnabled" value="true"/>
   </appSettings>
 </configuration>
Other Diagnostic and Monitoring Tools in Platform SDK
Messages Sent/Received
Platform SDK automatically collects information about the number of messages which were sent and received for each individual channel, along with a total for all channels. String constants (names) which are used for managing PerformanceCounters are as follows:
 public const string CategoryName = "Genesyslab PSDK .NET Messages";
 public const string MessagesSentCounterName = "Messages Sent/sec";
 public const string MessagesReceivedCounterName = "Messages Received/sec";
And the name of the instance which collects total information is:
public const string TotalInstanceName = "_Total";They all are defined in MessagesMonitoring class in the Genesyslab.Platform.Commons.Protocols.Diagnostics namespace.
Viewing Genesys Platform SDK Diagnostic Data Using 'perfmon.exe'
Performance Monitor Tool
The Performance Monitor tool ('perfmon.exe' included in Windows OS starting with NT 3.0) can be used to view and monitor all of the Genesys Platform SDK diagnostic values described above.
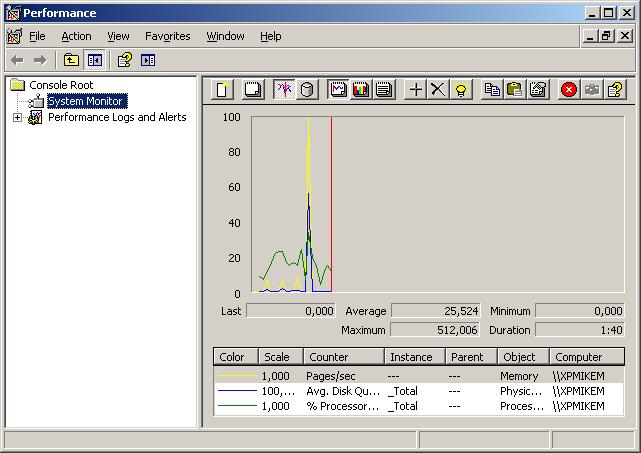
To start 'perfmon.exe', press Start > Run…, type "perfmon" into the opened window, and than press Ok. The following application will be opened:
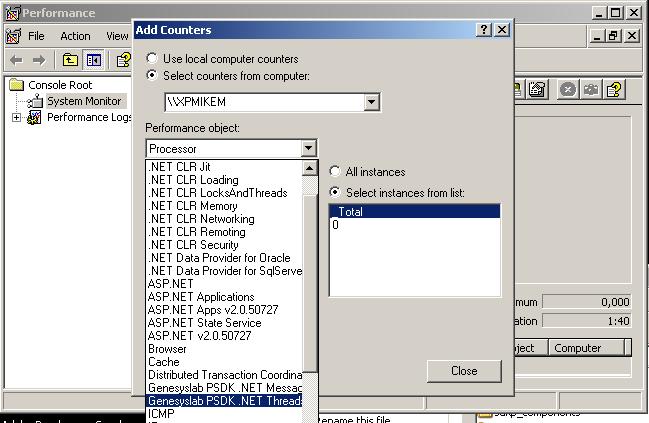
Then you can add Genesyslab PSDK counters. Press 'Add Counters…' (or press Ctrl+I), choose the host where you want to see counters, and then select 'Genesyslab PSDK .NET' performance object in the appropriate combo-box:
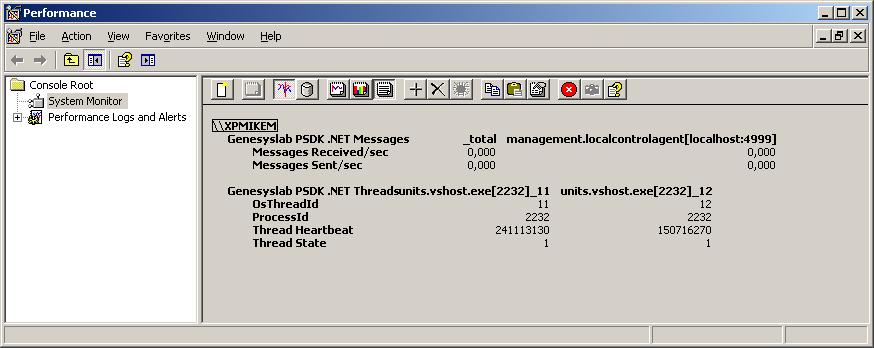
After that you can select the exact performance counters and which instances they are related to. Now 'perfmon' will show the selected values, for example in 'Report' view as following:


