Contents
CCAdv/WA Mobile View Dashboard
35px|link= You can check the Pulse Advisors dashboards on your mobile device using a supported browser. This page gives you an overview of the Contact Center Advisor and Workforce Advisor applications for mobile devices.
You can view the full Advisors desktop dashboard on your mobile device, if necessary, but the dashboards are available as an optimized view that is intended specifically for mobile device users. The Contact Center Advisor (CCAdv) and Workforce Advisor (WA) mobile views give you access to the desktop dashboard's Contact Centers pane and the Alerts pane.The Advisors mobile view is designed to be an express service; it is not intended to be a replacement for the desktop dashboards.
To access the mobile view on your device, open a browser that supports Advisors applications and enter the URL that you use to access your Advisors desktop application. When you initially log in, you see the top level of the mobile view. This is the Contact Centers pane from the Advisors desktop applications, and is presented as a list in the mobile view. You can drill down to lower levels of the hierarchy from this top-level view. For more information, see Example: Drilling down through the hierarchy in mobile view, below.
The Advisors mobile view includes tooltip information for buttons that display at the top of the mobile dashboard, but there are no tooltips associated with metrics. To use the mobile view effectively, you need to be familiar with at least one Advisors desktop dashboard and have an established list of metrics that you typically watch.
The Advisors mobile dashboard view uses the same formatting that is configured for the desktop application. For example, if the values for metrics show two decimal places in the desktop dashboard view, then the mobile view also shows metrics values with two decimal places.
Device-aware Applications
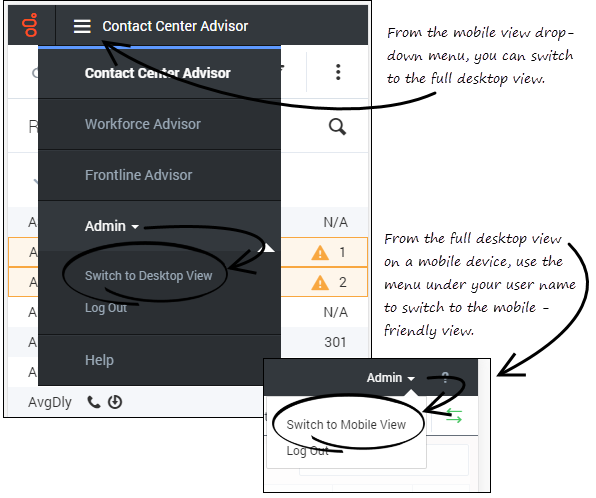
Advisors applications are device-aware. If you log in to an Advisors application on a mobile device, then the mobile view of the application opens. In the drop-down menu at the top of the mobile application, there is an option that lets you switch to the desktop view. When viewing the full CCAdv or WA dashboard on your mobile device, you can easily switch back to the mobile view by selecting that option in the menu under your user name.
There is no option to switch to the mobile-device view when you are using a desktop device to view the Advisors dashboards.
Advisors Mobile View Overview
When you initially open the Contact Center Advisor or Workforce Advisor application on a mobile device, you see the hierarchy that displays in your desktop application's Contact Centers pane. You will recognize some of the information and buttons that display on the toolbar at the top of the mobile view from your desktop application. The following table describes the toolbar options.
Changing the Displayed Metrics in Mobile View
Advisors mobile view does not include Column Chooser. The easiest way to change the group of metrics that you are viewing and tracking in your mobile view is to select a different metrics library. Metrics libraries are available for selection in the mobile dashboard Filter pane, but only if you have access to Column Chooser in the desktop application. Genesys recommends that you create metrics libraries using your desktop application's Column Chooser before attempting to change the list of metrics that you are viewing on a mobile device. However, if you need to display a metric on your mobile view that is not currently included in one of your metrics libraries, and you do not have access to a desktop device, then you can switch to desktop view on your mobile device, open Column Chooser, and change the list of metrics selected for dashboard display. The display of metrics in both your desktop application and your mobile view is updated whenever you make changes to the list of selected metrics in the desktop application's Column Chooser window. Refresh your mobile view to see the updated selection of metrics.
Example: Drilling down through the hierarchy in mobile view
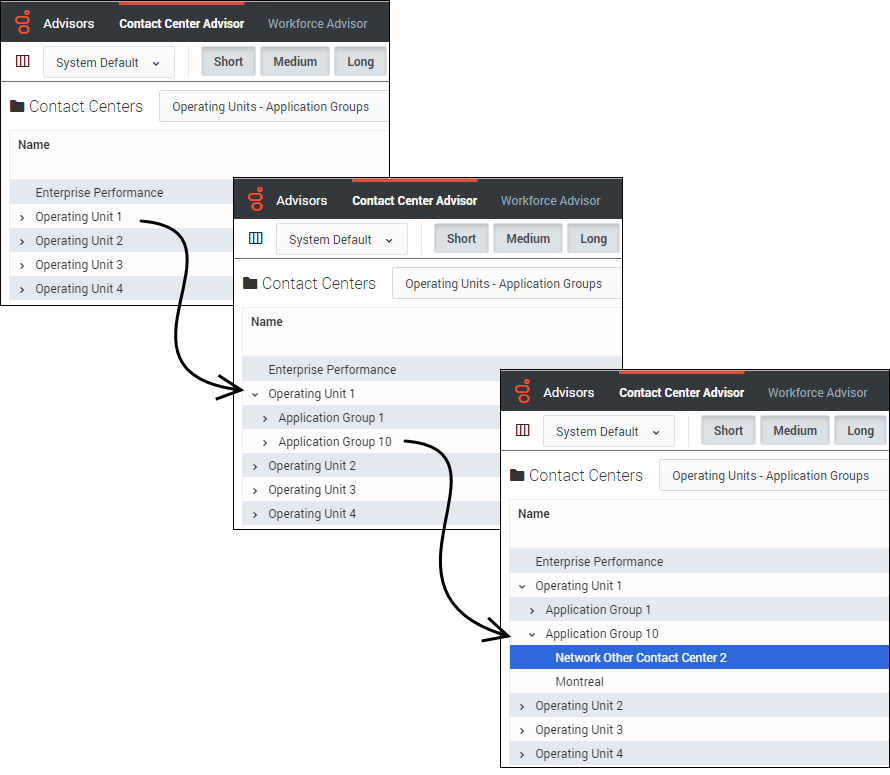
The figures below compare navigation in the CCAdv desktop application's Contact Centers pane with navigation in the hierarchy view on a mobile device to demonstrate how to drill down (or up) through the mobile view hierarchy to find information about business objects and how they are performing.
The following figure shows how to drill down through the hierarchy in the Contact Centers pane when you use the CCAdv desktop application.
The following figure shows how to drill down through the hierarchy in the CCAdv mobile view. This is the same hierarchy that is demonstrated in the preceding figure. In the mobile view, you tap the arrow beside a business object name to drill down or up through the hierarchy.
Alerts Screen in Mobile View
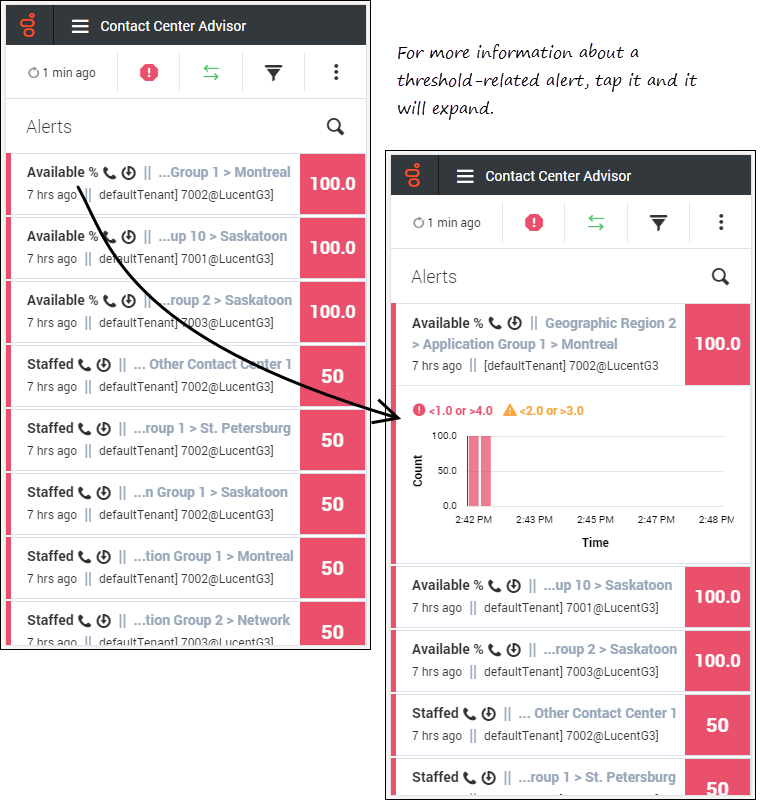
The following figure shows the Alerts pane in the CCAdv mobile view. Threshold-related alerts display a summary view when you open the Alerts pane. You can tap this type of alert to expand it and find additional information.


